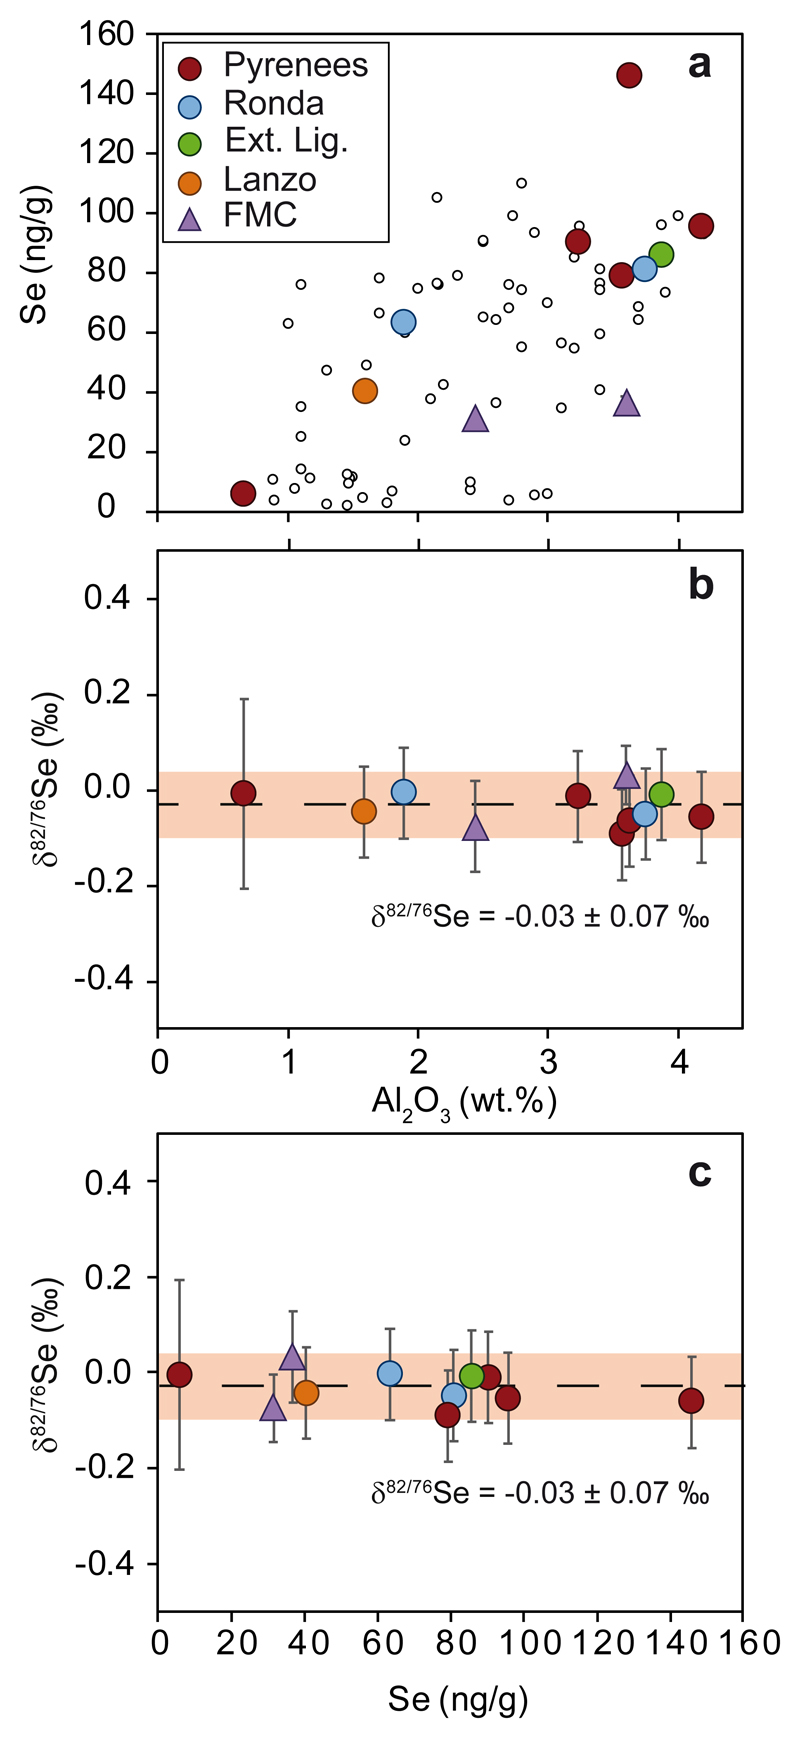
Figure 1. Se and Al2O3 contents and Se isotope data of mantle peridotites.
(a) Se vs. Al2O3, and δ82/76Se vs. (b) Al2O3 and (c) Se of post-Archean peridotites. Circles represent orogenic and transitional peridotites and triangles mantle xenoliths. Small circles in (a) correspond to previously published peridotite data5,16. 1 s.d. uncertainties on concentrations are similar or smaller than symbol size, whereas error bars in (b) and (c) indicate 2 s.d. uncertainties of more than two combined measurements. If not available, the analytical uncertainty obtained for repeated analysis of peridotites is reported (± 0.10‰, 2s.d.) (see Methods). The shaded field represents the 2 s.d. of the mean of peridotites as discussed in the text.

