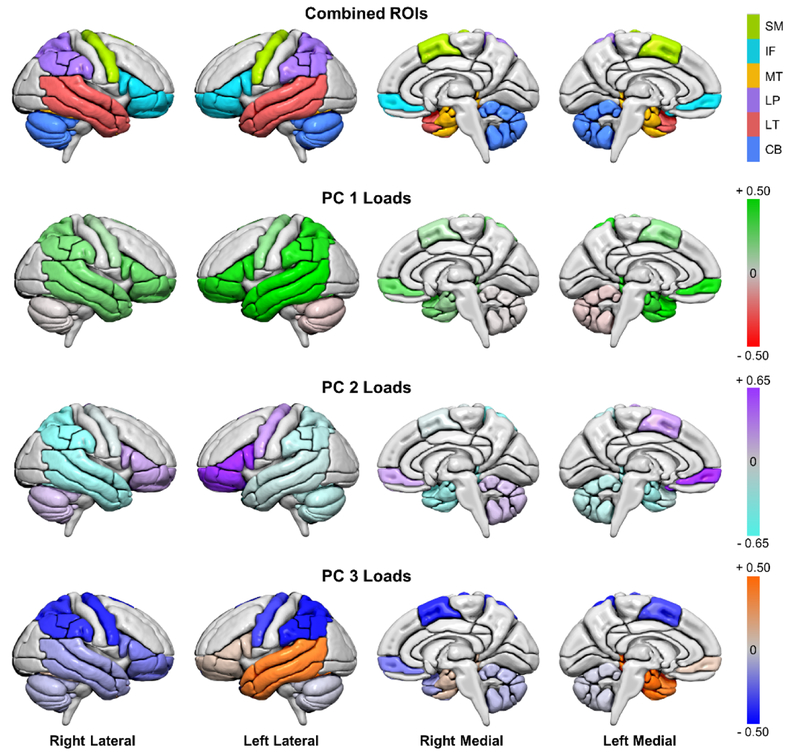
Figure 2.
Lateral and medial views of regions of interest (ROIs) from the AAL atlas shown in MCALT space; colors note larger regions of interested often affected in PPA. Loadings are shown for each principal component (PC) in those ROIs. Note: SM = Supplementary Motor. IF = Inferior frontal; MT = medial temporal; LP = lateral parietal; LT = lateral temporal; CB = cerebellum. For clarity, the range for PC 2 loadings was increased because of the similarity in high loadings across multiple regions. Renders created using Surf Ice (2017).

