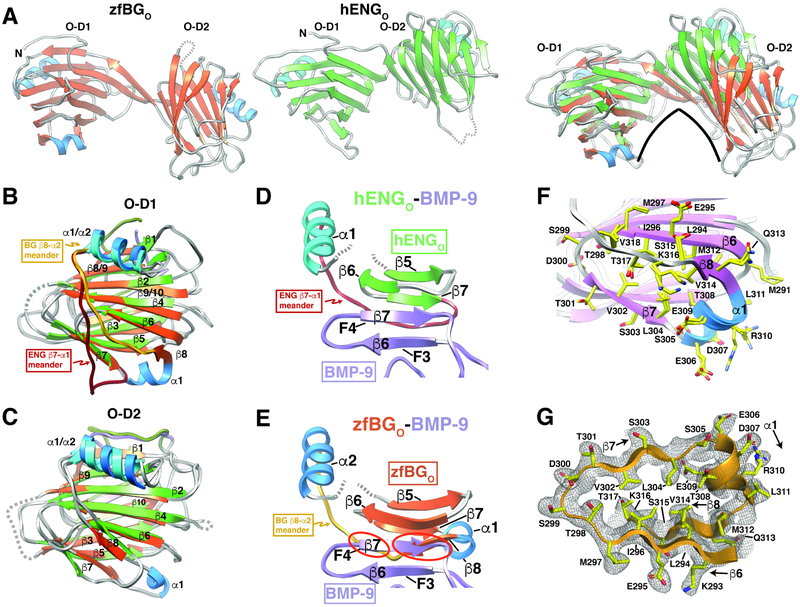
Figure 4. Structural comparison of zfBGO and hENGO.
A. Comparison of the overall structures of zfBGO and hENGO, whose strands and helices are shaded orange and blue and green and blue, respectively. Changes in the relative domain orientation of zfBGO and human ENGO (green β-strands, cyan helices) is shown in the right most subpanel in which only the backbone atoms of O-D1 have been superposed. B-C. Superposition of zfBGO and hENGO O-D1 (B) or O-D2 (C). Distinct orientation of the O-D1 “meander” loop connecting β8-α2 in zfBGO and β7-α1 in hEngO is highlighted. Structures are shaded as in panel A, with additional shading of the β8-α2 meander in zfBGO-D1 and β7-α1 meander in hENGO-D1 in gold and dark red, respectively. D. Region of super β-sheet formation in the hENGO:BMP-9 complex, but only with the β-strands corresponding to fingers 3 and 4 (F3 and F4) of BMP-9 shown and the segment of hENGO extending from β5 to α1 shown. E. Depicts the same as that shown in panel D, but with zfBGO in place of hENGO; structure shown was generated by superimposing zfBGO onto hENGO in the structure of the hENGO:BMP-9 complex and then by undisplaying hENGO. Superposition highlights clashes (red circles) between zfBGO β8 and finger 4 of BMP-9 for this mode of binding. F. Overlay of the two P212121 zfBGO models and one P41 zfBGO model in the region including an additional α-helix (α1) and β-strand (β8) compared to hENGO. G. 2mFo-DFc electron density for P212121 zfBGO (chain A) extending from β6 to α2; map shown was calculated with phenix.maps with a bulk solvent correction and anisotropic scaling and was contoured at 1σ. See also Figures S1, S3, and S8.

