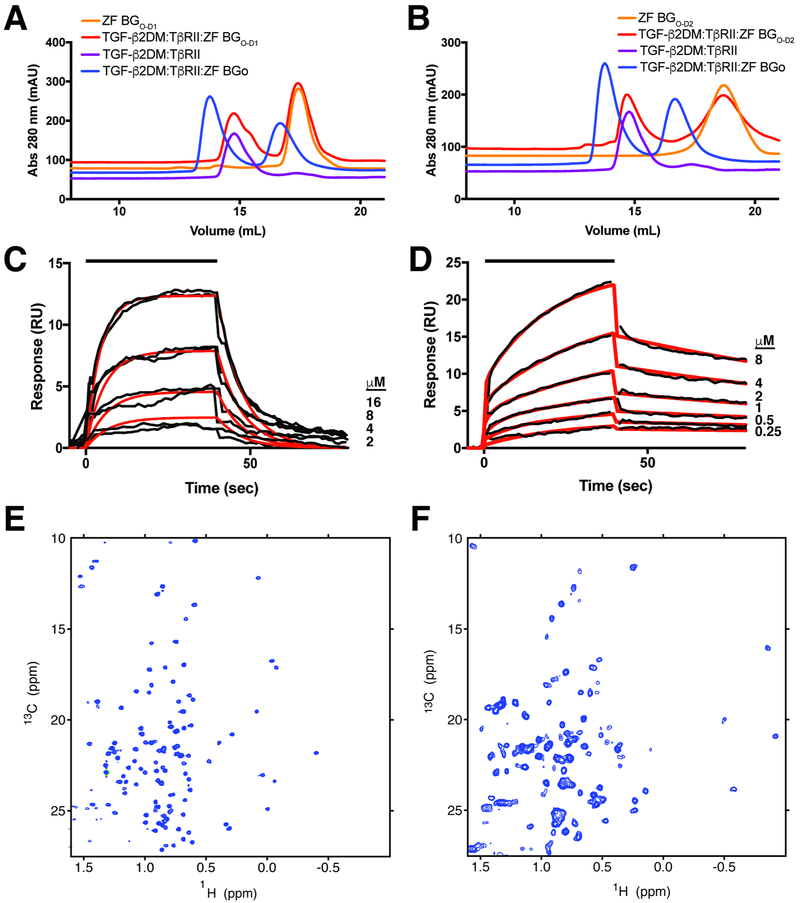
Figure 6. Binding of zfBGO-D1 and zfBGO-D2 to TGF-β2.
A, B. SEC chromatograms of complexes between zfBGO and zfBGO-D1 (A) and zfBGO and zfBGO-D2 (B) with TGF-β2DM and TβRII are depicted in blue and red, respectively. Chromatograms of the TGF-β2DM:TβRII binary complex and zfBGO-D1/zfBGO-D2 alone are shown in purple and orange curves, respectively. C, D. SPR sensorgrams for binding of zfBGO-D1 (C) and zfBGO-D2 (D) to immobilized TGF-β2. Kinetic fit is shown in red over the experimental data shown in black. SPR sensor chip with immobilized TGF-β2 is the same as that used for the experiments shown in Figs 2 and S2. E-F. Methyl region of natural abundance 1H-13C HSQC spectra of BGO-D1 (E) and BGO-D2 (F).

