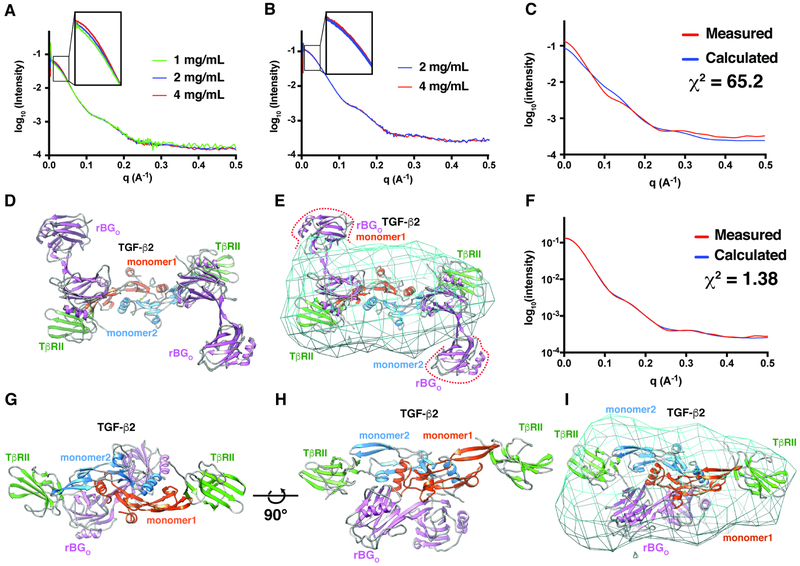
Figure 7. Structural modeling of the complex of BGO with TGF-β2 and TβRII.
A-B. SAXS data for 1:2:1 TGF-β2TM:TβRII:zfBGO (A) or 1:2:1 TGF-β3:TβRII:rBGO (B) complexes at the concentrations shown (scattering curves are scaled by the expected dilution factor). Insets highlight concentration-dependent changes in the low-q region. C-E. Comparison of the experimental SAXS data for the 1:2:1 TGF-β3:TβRII:rBGO complex (red) with the scattering curve calculated (blue) (C) from a 1:2:2 TGF-β3:TβRII:rBGO model with rBGO positioned in an hENGO-like manner (D). Calculated electron density map for the 1:2:1 TGF-β3:TβRII:rBGO complex contoured at 1.5 sigma with the hENGO-like 1:2:2 TGF-β3:TβRII:rBGO model fitted into the density. F-I. Comparison of the experimental SAXS data for the 1:2:1 TGF-β3:TβRII:rBGO complex (red) with the calculated scattering curve (blue) (F) from the best scoring 1:2:1 TGF-β3:TβRII:rBGO model derived from positioning rBGO onto the 1:2 TGF-β3:TβRII binary complex using pyDockSAXS (G, H). Calculated electron density map for the 1:2:1 TGF-β3:TβRII:rBGO complex contoured at 1.5 sigma with the pyDockSAXS 1:2:1 TGF-β3:TβRII:rBGO model fitted into the density. Estimated resolution of the electron density map shown in panels E and I from Fourier shell correlation analysis is 30.9 Å. See also Figure S10.

