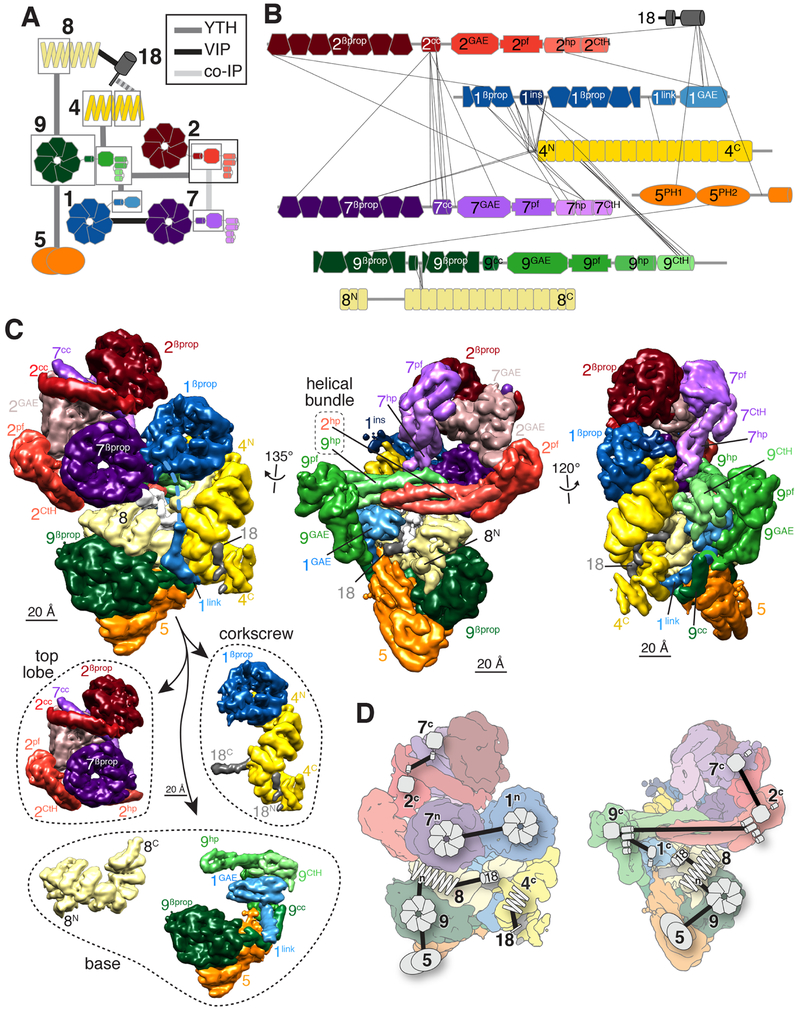
Figure 2. Manual assignment of BBSome subunit domains to densities in the cryo-EM map.
A. Diagram summarizing the binary interaction studies. Interactions were identified by yeast-two hybrid (YTH, Fig. S3B), visual immunoprecipitation (VIP), and co-immunoprecipitation (co-IP) experiments. Individual datasets are depicted in Fig. S3A. Domains are boxed when interactions were assigned to specific fragment of a given subunit. Each subunit has a different color, and domains within a subunit are shown in lighter color shades from N to C termini. The same color scheme is used in all panels. B. Inter-subunit crosslinks identified by mass spectrometry mapped onto the subunits. Each subunit is drawn to the scale of its length. The numbers identify the subunit and the superscripts denote the specific domain: βprop, β-propeller; cc, coiled coil; GAE, γ-adaptin ear; pf, platform; hp, hairpin; CtH, C-terminal helix bundle; ins, insert; link, linker; PH, pleckstrin homology. C. Upper panels: The same three views presented in Fig. 1C are shown after manual segmentation. Domains are labeled as in B. Lowerpanel:The BBSome is shown segregated into its three main structural components, the top lobe consisting of BBS2 and BBS7, the corkscrew consisting of BBS4, BBS18 and the β-propeller of BBS1, and the base, which is shown as BBS8 and the assembly of BBS5, BBS9 and the linker and GAE domains of BBS1. D. Binary interactions mapped onto flattened views of the segmented map that were used to manually assign domains of BBSome subunits to specific densities in the cryo-EM map. The symbols correspond to those used in A. F. Angular distribution for BBSome projections.

