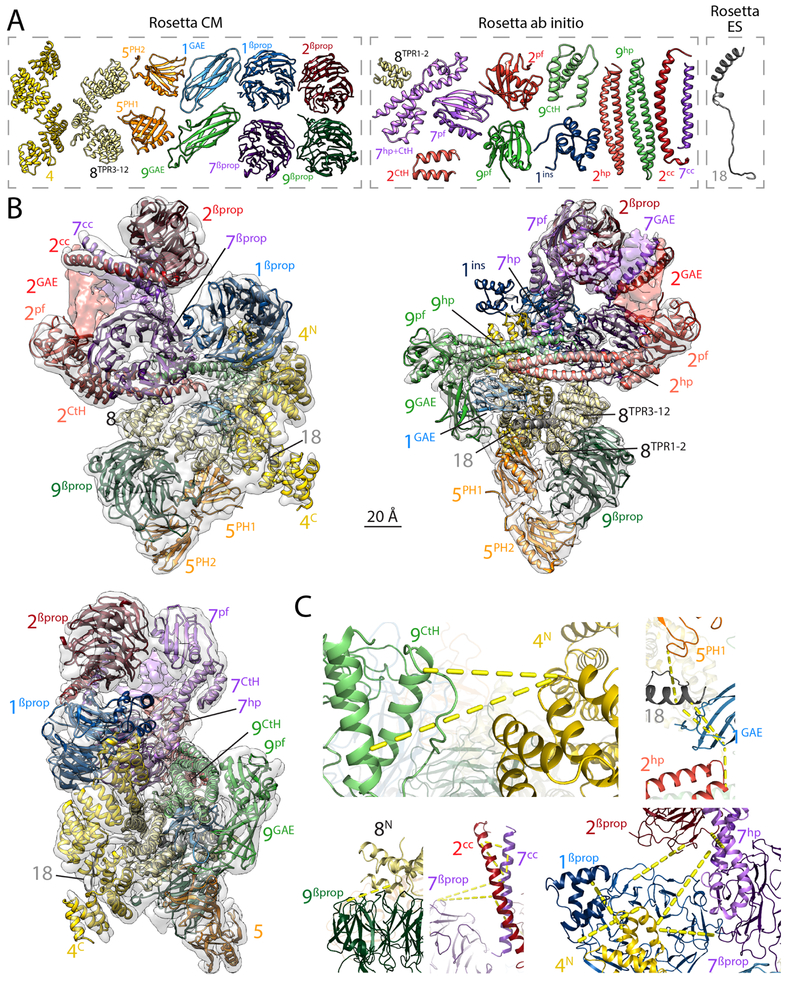
Figure 3. Rosetta-generated Cα model of the BBSome.
A. Cα models of the 24 domains from BBSome subunits that were obtained with three different Rosetta modeling protocols (CM, ab initio, and ES; see Materials and Methods for details) and could be assembled into the Cα model of the BBSome. Although the GAE domains of BBS2 and BBS7 could be modeled using co-evolutionary data (see Fig. S4), they are not shown because they could not be satisfactorily built into the cryo-EM density map. The colors and labels are as in Figure 2. B. Nearly complete Cα model of the BBSome obtained using Rosetta to assemble the 24 domains into a complex, guided by the cryo-EM density map and XLMS data (see Materials and Methods for details). The three views are the same as in Fig. 1C. The GAE domains of BBS2 and BBS7 are not included in the final Cα model but their general placement is indicated by coloring the density map. C. Magnified views of crosslink clusters in the final BBSome model. The yellow dotted lines indicate crosslinks that were satisfied by the final Rosetta molecular model. For clarity, only selected crosslinks of each cluster are shown. Depicted crosslinks are: Top Left: 9CtH[K789]- 4N[K116] and 9CtH[K810]-4N[K116]. Top Right: 5PH1[K87]-18[K90], 18[K90]-1GAE[K553], 18[K93]-1GAE[K553] and 1GAE[K553]-2hp[K638]. Bottom Left: 9βprop[K218]-8N[K181]. Bottom Middle: 7βprop[K56]-7cc[K352], 7βprop[K56]-2cc[K345], 2cc[K360]-7cc[K359], 2cc[K360]-7cc[K352], 7cc[K359]-7cc[K352], 2cc[K345]-7cc[K352] and 2cc[K345]-7cc[K338]. Bottom Right: 2 βprop[K9]-1βprop[K69], 2 βprop[K13]-7hp[K658], 4N[K20]-7hp[K659], 4N[K20]-7βprop[K222], 4N[K5]-1βprop[K143], 1βprop[K192]-4N[K25].

