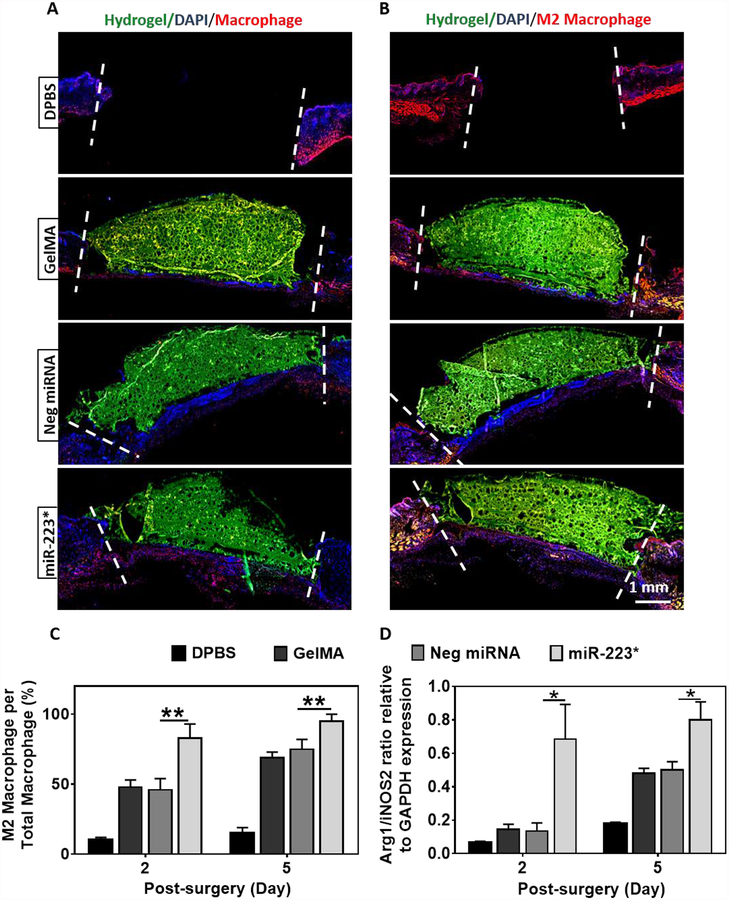
Figure 7. Immuno-histological and quantitative analysis of wounds for macrophage evaluation after 2- and 5-days of treatment.
(A, B) Representative immunofluorescent stained images for total macrophage and M2 phenotype expression from the center of wound after 2 days of treatment with DPBS, GelMA, Neg miRNA, and miR-223* hydrogels. Total macrophage marker (F4/80) and M2 macrophage (anti-mannose receptor antibody) are shown in red color. Blue color represents nuclei (DAPI), and green color represents GelMA. (C) Quantitative analysis of M2 macrophages/total number of macrophages, per viewing field after 2 and 5 days of treatment (Only red stained cells in the wound area are counted, that is the area between 2 white dashed lines) (viewing field=2.5mm). (D) qPCR analysis of Arg1/iNOS2 mRNA expression for wound biopsies after 2 and 5 days of treatment relative to GAPDH expression. Data are represented as mean ± SD (*p < 0.05, **p < 0.01, n ≥ 3).

