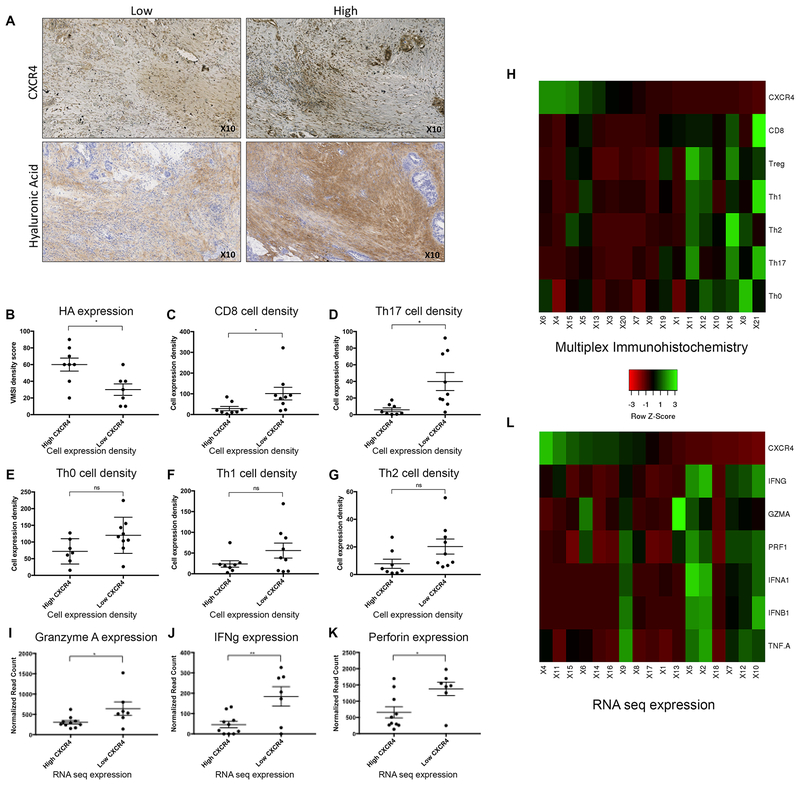
Figure 5. Relationships of hyaluronan and the CXCR4 axis are appreciated in human PDAC in the setting of GVAX.
Human PDAC tissue were collected from patients after one dose of neoadjuvant GVAX and subsequent surgical resection at our institution (n=22). (A) Immunohistochemistry (IHC) staining of CXCR4 (n=17) and hyaluronan (HA) expression was performed (n=15). (B) Analysis of HA expression in GVAX treated PDAC tumor with high stromal CXCR4 expression compared to tumor with low CXCR4 expression by IHC. The percentage of total cell subsets, as determined by multiplex IHC, were compared between high vs low CXCR4 expression groups: (C) CD8+ T-cells: [CD45+CD3+CD8+] (D) Th17+ T-cells: [CD45+CD3+CD8+Foxp3−RORlt+] (E) Th0: [CD45+CD3+CD8−Foxp3−RORgt−Tbet−GATA3−] (F) Th1: [CD45+CD3+CD8−Foxp3−RORgt−Tbet+] (G) Th2: [CD45+CD3+CD8−Foxp3−RORgt−GATA3+]. (H) Heat map generated to visualize the relationship of protein expression of CXCR4 and the density of immune cell infiltrates, particularly CD8+ T-cells, according to the quantification of IHC results. Whole exome RNA sequencing was performed on dissected pancreatic stroma of the same cohort of patients (n=17). (H) Granzyme A (I) IFNγ and (J) Perforin expression in PDAC tumor with high stromal CXCR4 expression were compared to tumor with low CXCR4 expression. (K) Heat map generated to visualize the relationship between the RNA expression of CXCR4 and the expression of markers of effector T-cell function. Data represent mean ± SEM. ns not significant, * p<0.05,** p<0.01

