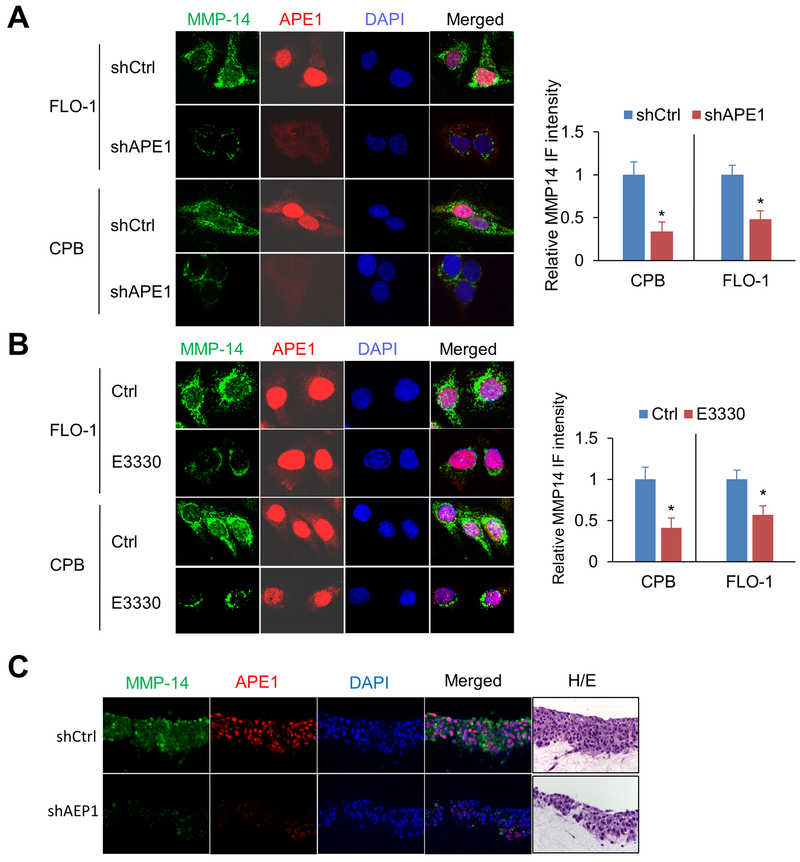
Figure 4. APE1 silencing or APE1 redox-specific inhibition decreases MMP-14 protein levels.
Representative immunofluorescent images of MMP-14 (green) and APE1 (red) in FLO-1 or CPB cells; nuclei were stained with DAPI (blue). A, APE1 stable knockdown cells (shAPE1), and their control cells (shCtrl). B, Cells were treated with 40μM E3330 or vehicle control (Ctrl) for 24 h before staining. C, 3D organotypic culture of CPB cells with stable knockdown (shAPE1) or control (shCtrl). Hematoxylin and eosin (H&E) staining of sequential cut of the same blocks used for immunofluorescence staining. The quantification of MMP-14 intensity was expressed as the mean ± SEM of 3 independent fields. *, p < 0.05.

