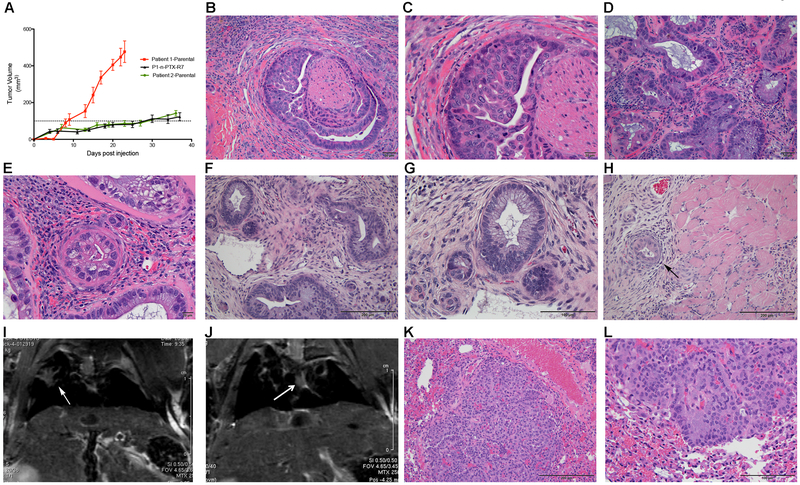
Fig. 3. CR cells form tumors in mice that exhibit histologically accurate features of PDAC.
(A) Tumor growth kinetics of Patient 1-Parental, Patient 2-Parental and P1-n-PTX-R7 (Patient 1-n-PTX-R7) CR-PDX tumors (N=3 separate experiments). The Patient 1-Parental tumors reached their endpoint at day 23. (B,C) Representative histological images of Patient 1-Parental tumors at 20x and 40x magnification, respectively. (D,E) Representative histological images of Patient 2-Parental tumors at 20x and 40x, respectively. (F,G) Representative histological images of P1-n-PTX-R7 tumors at 20x and 40x, respectively. (H) Local invasion of hind limb muscle by P1-n-PTX-R7 tumors (10x). (I,J) Representative T2-RARE (Rapid Acquisition with Refocused Echo) magnetic resonance images of lung tumors (arrows) in P2-nPTX-R6 and P1-n-PTX-R7 tumor-bearing mice. (K,L) Histological images (10x and 20x, respectively) of P1-n-PTX-R7 lung metastases.

