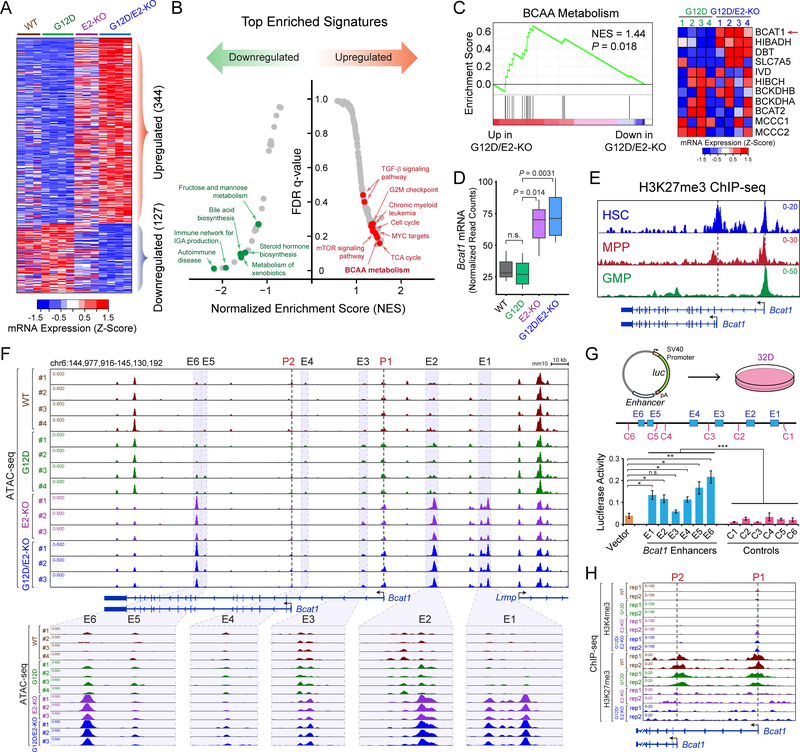
Figure 3. Loss of EZH2 Reactivates BCAT1 in Myeloid Neoplasms.
A. Heatmap showed Z-scores of DEseq2 normalized read counts for differentially expressed genes identified by RNA-seq in BM LSK cells 2 weeks post-pIpC. N = 3, 4, 3 and 4 mice for WT, G12D, E2-KO and G12D/E2-KO, respectively.
B. Top enriched signatures in upregulated or downregulated genes in G12D/E2-KO LSK cells.
C. GSEA showed the upregulation of BCAA metabolism related genes in G12D/E2-KO LSK cells. Heatmap showed Z-scores of DEseq2 normalized read counts for genes in BCAA metabolism pathway.
D. Bcat1 mRNA was upregulated in E2-KO or G12D/E2-KO relative to WT or G12D LSK cells. Y axis showed normalized read counts of Bcat1 by DEseq2. P value was calculated by a two-sided t-test. Boxes showed median of the data and quartiles, and whiskers extend to 1.5x of the interquartile range.
E. Density maps for ChIP-seq of H3K27me3 at Bcat1 gene (chr6:144,975,000–145,095,000; mm10) in BM HSC, MPP and GMP cells. Dashed lines and arrowheads indicate Bcat1 transcriptional start sites (TSS).
F. EZH2 KO increased chromatin accessibility at Bcat1 promoters and distal elements. Results from ATAC-seq (chr6:144,977,916–145,130,192; mm10) in WT, G12D, E2-KO and G12D/E2-KO LSK cells are shown. N = 4, 4, 3, and 3 for WT, G12D, E2-KO and G12D/E2-KO, respectively. Bcat1 promoters (P1 and P2) and putative enhancers (E1 to E6) are indicated by dashed and shaded lines, respectively. The zoom-in view of each enhancer is shown on the bottom.
G. Bcat1 distal elements with increased ATAC-seq enhanced reporter expression relative to vector or neighboring control DNA sequences (C1 to C6). Schematic of enhancer reporter assays in 32D cells is shown. Results are mean ± SEM (N = 3 experiments) and analyzed by a two-sided t-test. *P < 0.05, **P < 0.01, ***P < 0.001, n.s. not significant.
H. EZH2 KO decreased H3K27me3 and increased H3K4me3 at Bcat1 promoters. Results from ChIP-seq (chr6:145,087,000–145,037,000; mm10) in WT, G12D, E2-KO and G12D/E2-KO LSK cells (N = 2 mice per genotype) are shown.

