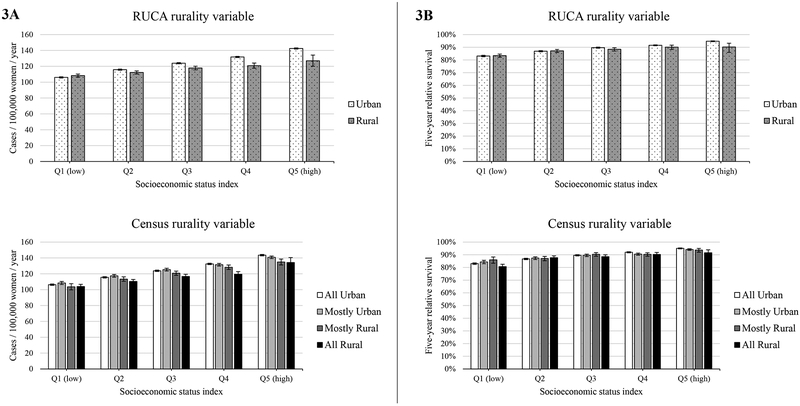
Figure 3.
Breast cancer incidence (panel A) and survival (panel B) across quintiles of socioeconomic status (SES) using two measures of rurality; Surveillance, Epidemiology, and End Results, 2005–2014. Survival indicates five-year relative survival among cases diagnosed from 2005–2009. Top figures in each panel indicate outcomes using the United States Department of Agriculture’s (USDA) Rural Urban Commuting Areas (RUCA), and bottom figures in each panel indicate outcomes using the Census Bureau’s classification of percent of residents living in non-urban. Leftmost columns indicate outcomes for women living in the most impoverished census tracts (Q1 for SES), while rightmost columns indicate outcomes for women living in the most affluent census tracts (Q5 for SES).

