
Figure 1.
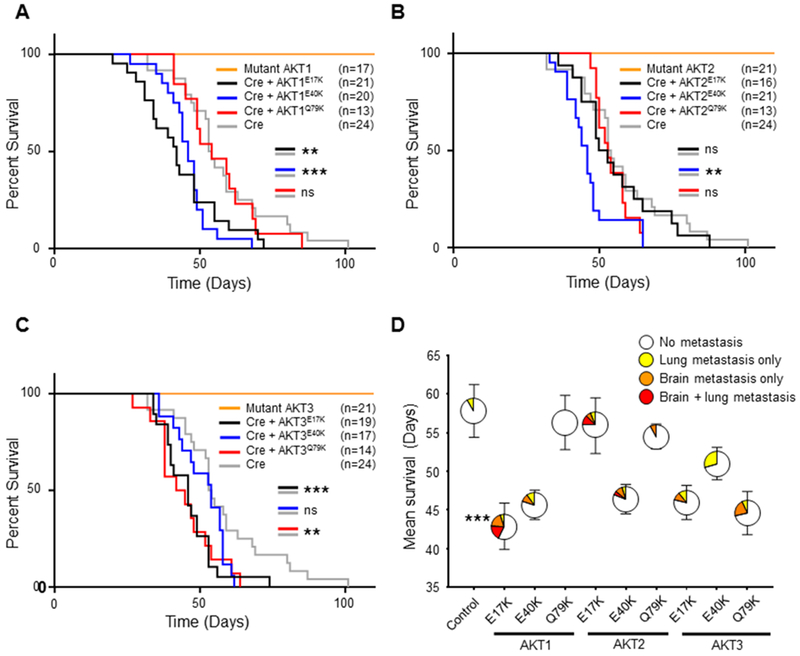
AKTE17K reduces survival and promotes brain metastasis in mice with melanoma. A, Kaplan-Meier percent survival curves for Dct::TVA;BrafCA;Cdkn2alox/lox;Ptenlox/lox mice injected with viruses encoding either Cre (gray line) (control), Cre + AKT1E17K (black line), Cre + AKT1E40K (blue line), Cre + AKT1Q79K (red line), or AKT1 (E17K, E40K or Q79K) alone (orange line). Cre + AKT1E17K and Cre + AKT1E40K reduced survival of mice compared with Cre alone (p = 0.0063 and 0.0004 respectively). B, Kaplan-Meier percent survival curves with comparable color scheme for AKT2 mutant cohorts; Cre + AKT2E40K reduced survival of mice compared with Cre alone (p = 0.0025). C, Kaplan-Meier percent survival curves with comparable color scheme for AKT3 mutant cohorts; Cre + AKT3E17K and Cre + AKT3Q79K reduced survival of mice compared with Cre alone (p = 0.0026 and 0.0058 respectively). A logrank (Mantel-Cox) text was used to determine significant differences between cohorts. D, Mean survival ± SEM depicted on the y-axis; colored areas in circles represent the percentage of mice that developed no metastases (white), lung metastasis only (yellow), brain metastasis only (orange), or lung and brain metastasis (red). The number of mice (n) for each cohort is equal to those depicted in (A-C). There was a significant increase in the incidence of brain metastasis (asterisk) in AKT1E17K mice compared with controls (38% versus 0% respectively) (p = 0.0009). A Fisher’s exact test (two-tailed) was used to determine significant differences in the incidence of metastasis. P values are as follows: p < 0.05 (*), p < 0.01 (**), p < 0.001 (***). ns = not significant.