
Figure 3.
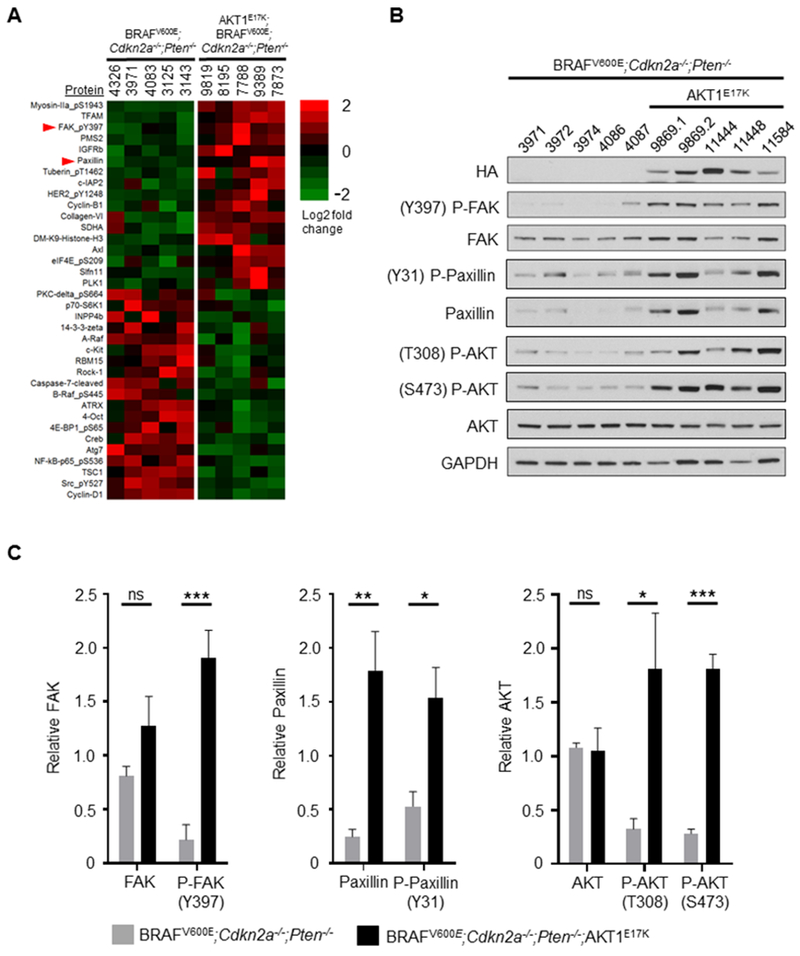
Phospho-FAK (P-FAK; Y397), paxillin, and phospho-paxillin (P-Paxillin; Y31) are upregulated in AKT1E17K-positive primary tumors. A, Reverse phase protein array (RPPA) was performed on BRAFV600E;Cdkn2a−/−;Pten−/− (control) and BRAFV600E;Cdkn2a−/−;Pten−/−;AKT1E17K (AKT1E17K-positive) primary tumors to identify differentially regulated proteins and phospho-proteins between the two groups. Significant results (p ≤ 0.05) are presented as a heatmap based on log2 fold change. B, Immunoblot analysis was performed on control and AKT1E17K-positive tumors followed by C, densitometry analysis from three independent blots to quantify total protein levels in each group. A significant increase in P-FAK expression (p = 0.0004), paxillin (p = 0.0030), P-paxillin (p = 0.0130), P-AKT (T308) (p = 0.0227), and P-AKT (S473) (p < 0.0001) was detected in AKT1E17K-positive tumors compared with controls. The numbers listed at the top of each column for (A) and (B) represent individual mouse numbers; 9869.1 and 9869.2 denote two separate primary tumors from mouse 9869. Significant differences between groups were determined using a two-tailed unpaired t-test. P values are as follows: p < 0.05 (*), p < 0.01 (**), p < 0.001 (***). ns = not significant.