
Figure 6.
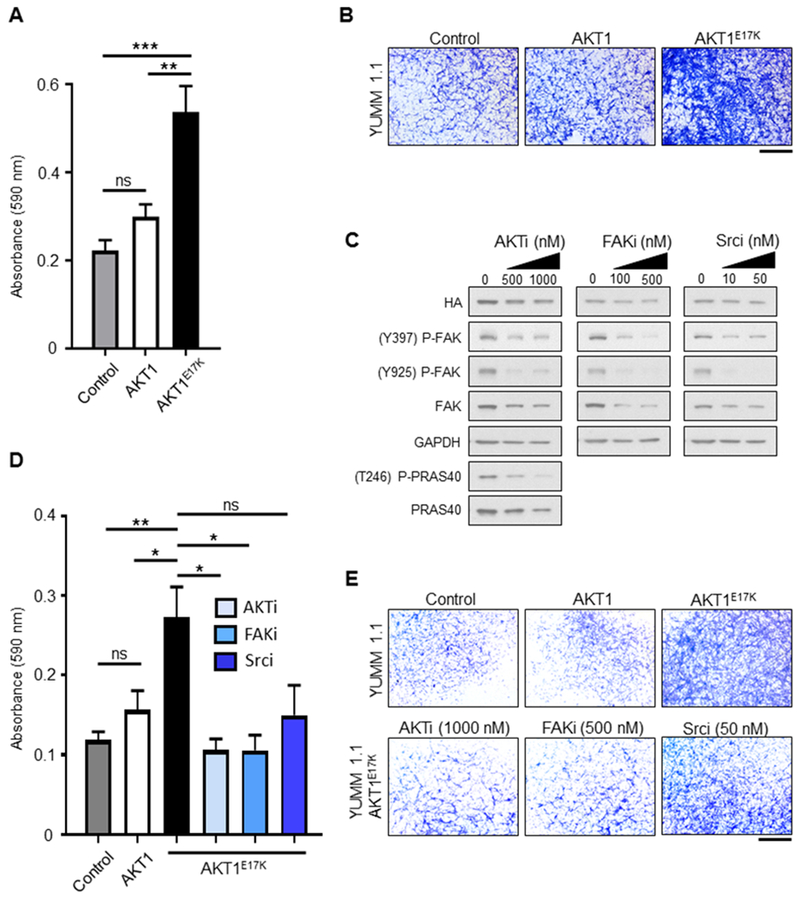
Expression of AKT1E17K promotes transwell migration and invasion. A, YUMM 1.1 control, wild type AKT1, or AKT1E17K-expressing cells were plated on the apical surface of transwells. The ability of cells to migrate through pores towards a chemoattractant was measured on day 3. Cells on the basolateral side of the transwells were fixed and stained with crystal violet. The relative absorbance of solubilized crystal violet was compared between conditions using an unpaired t test (n = 6 for each condition). AKT1E17K-expressing cells demonstrated enhanced migration compared with control (p = 0.0006) and AKT1 cells (p = 0.0046). B, Representative images of crystal violet staining for each condition in the migration assay are shown. Scale bar represents 1 mm. C, YUMM 1.1 AKT1E17K-expressing cells were treated with either DMSO vehicle control, 500 or 1000 nM GSK-2141795 (AKTi), 100 or 500 nM PF-573228 (FAKi), or 10 or 50 nM Dasatinib (Srci) daily for 5 days. Immunoblot analysis demonstrated targeted inhibition of P-FAK (Y397 and Y925) for drug-treated cells, as well as P-PRAS40 (T246) for AKTi-treated cells. D, YUMM 1.1 control, wild type AKT1, or AKT1E17K-expressing cells were plated on the apical surface of transwells above a layer of Matrigel in media supplemented with DMSO vehicle control (n = 10 transwells per condition); AKT1E17K-expressing cells were additionally plated in 1000 nM AKTi, 500 nM FAKi, or 50 nM Srci (n = 4 transwells per condition). The ability of cells to invade through Matrigel and pores towards a chemoattractant was measured on day 5. Cells on the basolateral side of the transwells were processed as per the migration assay in (A). AKT1E17K-expressing cells (black bar) demonstrated enhanced invasion compared with control cells (gray bar) (p = 0.0010) and AKT1 expressing cells (white bar) (p = 0.0186). Inhibition of AKT (checkered box) and FAK (diagonally lined box) significantly reduced invasion of AKT1E17K-expressing cells (p = 0.0200 and 0.0205, respectively). The difference between AKT1E17K-expressing cells (DMSO) and those treated with the Src inhibitor (horizontally lined box) was not significant (p = 0.0847). E, Representative images of crystal violet staining for each condition in the invasion assay are shown. Scale bar represents 1 mm. P values are as follows: p < 0.05 (*), p < 0.01 (**), p < 0.001 (***). ns = not significant.