
Figure 7.
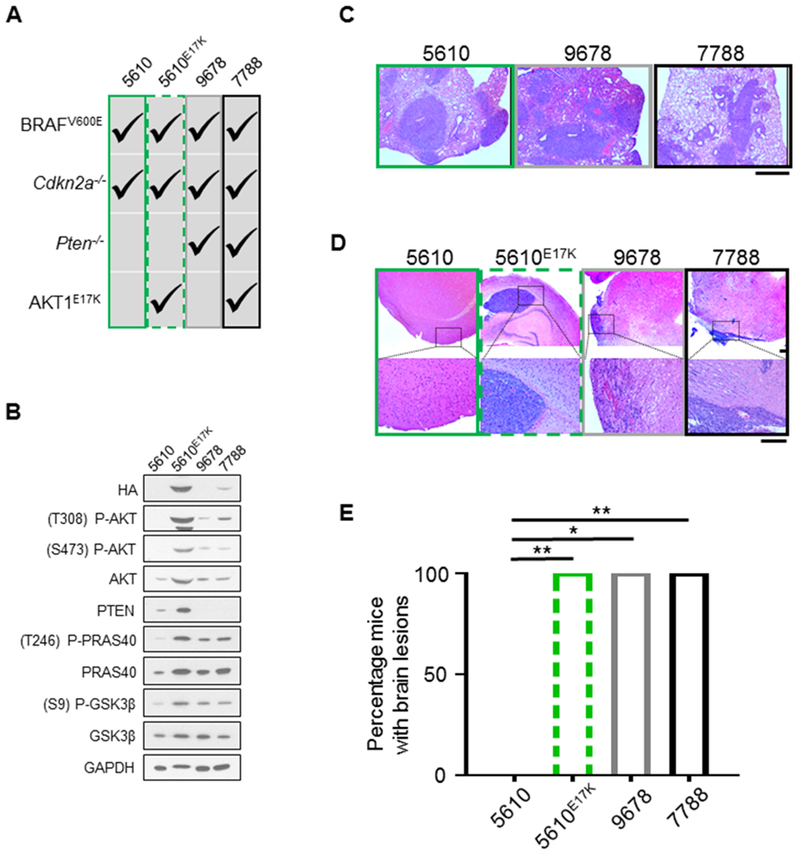
Aberrant PI3K/AKT pathway activity promotes melanoma brain colonization. A, The following primary tumor cell lines sourced from Dct::TVA mice were used: 5610 (BRAFV600E;Cdkn2a−/−) (green box), 5610E17K (BRAFV600E;Cdkn2a−/−;AKT1E17K) (green dashed box), 9678 (BRAFV600E;Cdkn2a−/−>;Pten−/−) (gray box), and 7788 (BRAFV600E;Cdkn2a−/−;Pten−/−;AKT1E17K) (black box). Alterations within each cell line are denoted by check marks. B, The four cell lines listed in (A) were subject to immunoblot analysis; results demonstrate hyperactivity of canonical PI3K/AKT pathway signaling in cells deficient in Pten and/or those that express AKT1E17K as evidenced by an increase in P-AKT, P-PRAS40, and P-GSK3β. C, H&E staining was used to detect lesions in the lung tissue sections of all mice. Mean survival ± SEM are reported for each cohort and all mice injected with 5610 (31.3 ± 1.7, n = 6), 9678 (29.2 ± 1.9, n = 6), or 7788 (35.5 ± 0.3, n = 6) developed lesions. Representative images are shown. Scale bar represents 1 mm. D, H&E staining was used to detect lesions in brain tissue sections of all mice. Representative images of a normal brain from the 5610 cohort, and brains with detectable lesions from the 5610E17K, 9678, and 7788 cohorts are shown. Scale bar represents 200 µm. E, Mean survival ± SEM are reported for each cohort and no mice intracranially injected with cell line 5610 (150 day endpoint, n = 6) developed detectable lesions, whereas all mice injected with cell lines 5610E17K (64.3 ± 8.6 days, n = 4) (green dashed box), 9678 (28.7 ± 0.7 days, n = 3) (gray box), or 7788 (32.8 ± 0.8 days, n = 4) (black box) were found to have tumor growth in the brain and these differences were statistically significant (p = 0.0048, 0.0119, and 0.0048, respectively). A Fisher’s exact test (two-tailed) was used to determine significant differences in incidence. P values are as follows: p < 0.05 (*), p < 0.01 (**), p < 0.001 (***). ns = not significant.