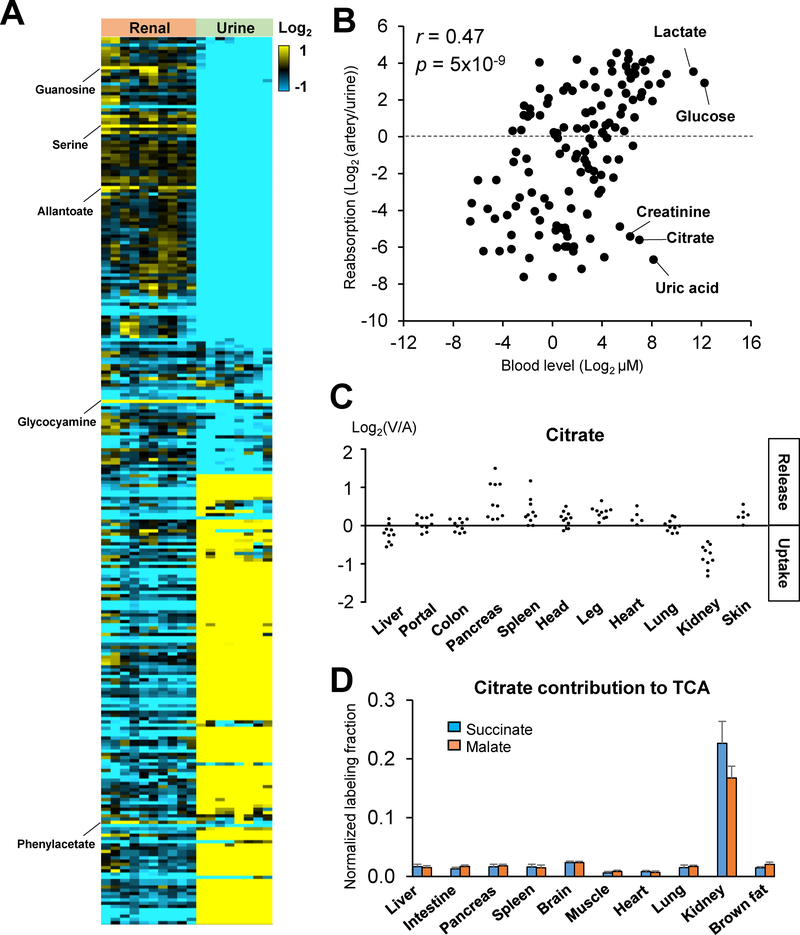
Fig. 2. The kidneys clear most metabolites, with citrate a kidney-specific fuel.
(A) Heat map of metabolite abundance (log2) in renal vein relative to the arterial blood (left) or urine relative to arterial blood (right) in pigs. Metabolites produced by the kidneys are highlighted on the left. (B) Correlation between a metabolite’s blood concentration and reabsorption efficiency. (C) AV difference of citrate across the indicated organs in pigs. Each data point reflects an independent venous blood draw. (D) Citrate contribution to TCA in mice. The kidneys are unique in using citrate as fuel. Mice were intravenously infused with [U-13C]-citrate, and average TCA intermediate carbon labeling was normalized to blood citrate labeling. Data are means and error bars are standard errors (N = 4 mice). See also Figure S3.

