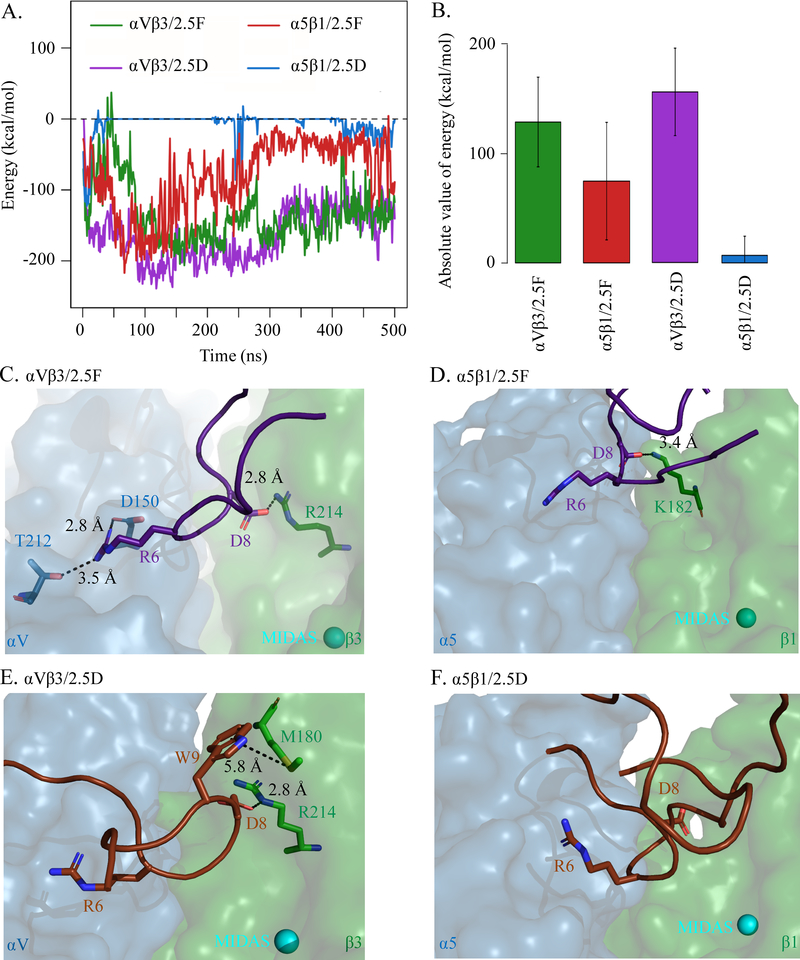
Figure 5. MD simulations of 2.5D/2.5F binding to αVβ3/α5β1.
Knottins were initially separated by 9Å. (A) Energy over time and (B) bar graph (mean± SD) showing absolute value of binding energies between 2.5D and 2.5F to αVβ3 and α5β1 averaged over 500 ns of simulation time. Difference between 2.5D/α5β1 and 2.5D/αVβ3, 2.5F/αVβ3, 2.5F/α5β1 is significant at p<2.20×10⁻¹⁶. (C, D) Selected residues in structures of MD simulation of 2.5F binding to αVβ3 at t=0.020 ns (C) and to α5β1 at t=1.250 ns (D). (E, F) Selected residues in structures of MD simulation of 2.5D binding to αVβ3 at t=0.960 ns (E), and to α5β1 at t=1.250 ns (F). Distances (dotted lines) are indicated. The head segment of the respective integrin is displayed. See also Supplemental Movie 1, 2, 3 and 4.

