
Figure 3. Survival curves according to CTC and DTC status in hormone receptor-positive patients.
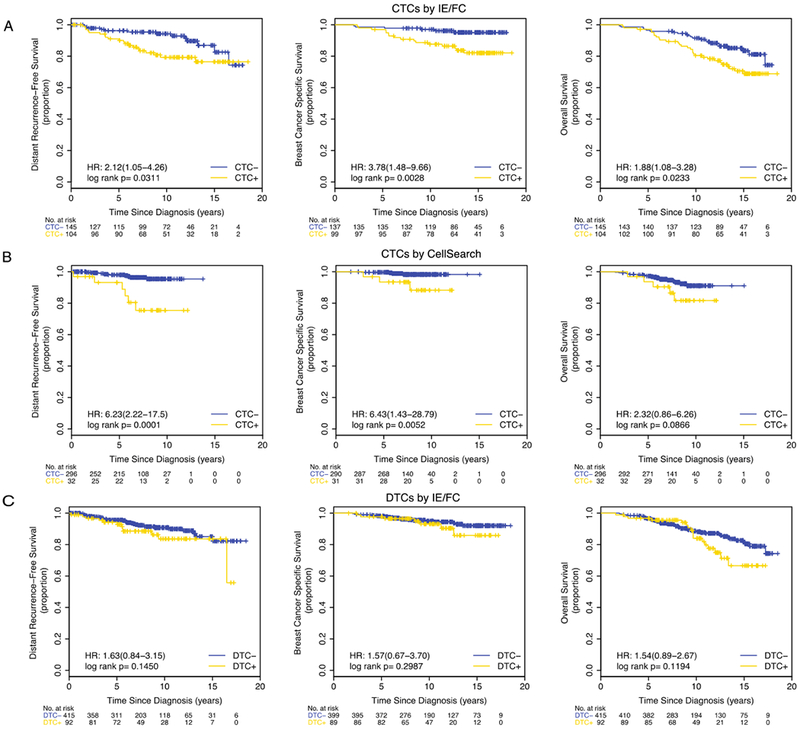
Kaplan-Meier plots are shown for the following subsets: (A) CTCs by IE/FC (cutoff >0.44 CTC per mL), (B) CTCs detected by CellSearch (cutoff ≥2 CTC per 7.5 mLs), and (C) DTCs by IE/FC (cutoff >18.61 DTC per mL).