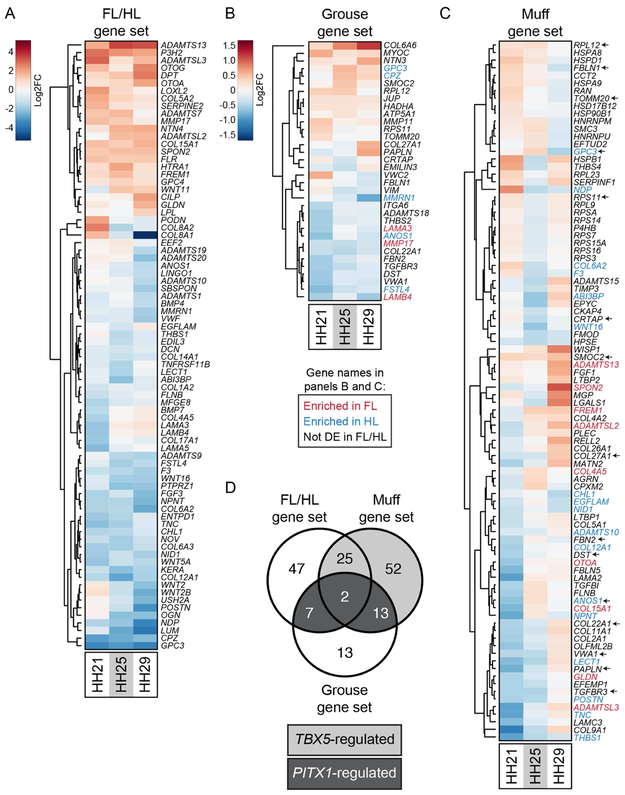
Figure 6. Differential expression of genes encoding extracellular matrix components is associated with pigeon limb identity.
(A-C) Gene-wise hierarchical clustering heat maps of genes encoding extracellular matrix (ECM) components that are significantly differentially expressed between FL vs. scaled HL (A), scaled HL vs. grouse HL (B), or scaled HL vs. muff HL (C). For (A-C), all ECM-encoding genes that are significantly differentially expressed at one or more stages are included in the heat map. The scale for (A) is Log2FC −5 (HL-enriched) to 5 (FL-enriched); the scale for (B) and (C) is Log2FC −1.5 (scaled HL-enriched) to 1.5 (muff HL-enriched). In (B) and (C), gene names highlighted in red or blue denote genes from FL vs. scaled HL comparison that are significantly FL-enriched or HL-enriched, respectively. In (C), arrows next to gene names highlight genes that are differentially expressed in both grouse and muff HLs relative to scaled HLs. (D) Venn diagram showing overlap of differentially expressed ECM-encoding genes from FL vs. scaled HL, scaled HL vs. grouse HL, and scaled HL vs. muff HL comparisons. Dark gray shading highlights ECM-encoding genes that are differentially expressed in all three comparisons and are putatively regulated by PITX1. Light gray shading denotes ECM-encoding genes that are differentially expressed only in FL vs. scaled HL and scaled HL vs. muff HL comparisons, suggesting regulation by TBX5.

