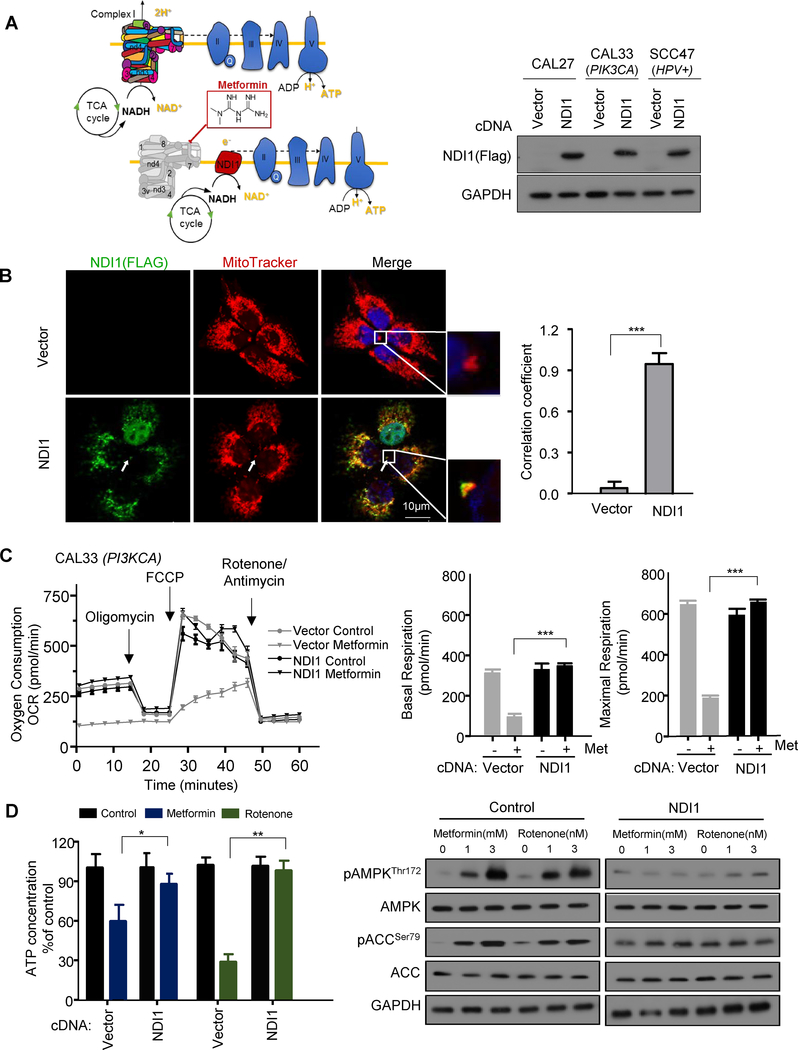
Figure 1.
Metformin activates AMPK signaling in HNSCC cells by inhibiting mitochondrial complex I. A, Schematic representation of yeast NDI1, which when expressed in HNSCC cells rescues the inhibitory effect of metformin on mitochondrial complex I in the respiratory chain. Western blot analysis of expressed NDI1 levels in HNSCC cell lines CAL27, CAL33, and UMSCC47. B, NDI1 (green) was colocalized with mitochondrial membrane marker MitoTracker (red). White arrow depicts examples of areas of colocalization, scale bar 10uM; Pearson’s correlation coefficient was 0.92. The coefficient was generated using Image J software. C, Representative measurement of OCR in control (CAL33; PIK3CA) and NDI1 expressing HNSCC cells after overnight metformin (3 mM) treatment. Basal and maximal FCCP-stimulated respiratory rates are plotted, and represent three technical replicates. D, Celluar ATP level was determined after overnight metformin (3 mM) treatment. Rotenone (3 nM) was used as a positive control. Western blotting for expression of pAMPK/AMPK, pACC/ACC, and GAPDH as a loading control. (*, P<0.05; **, P<0.01; ***, P<0.001; mean ± SD).

