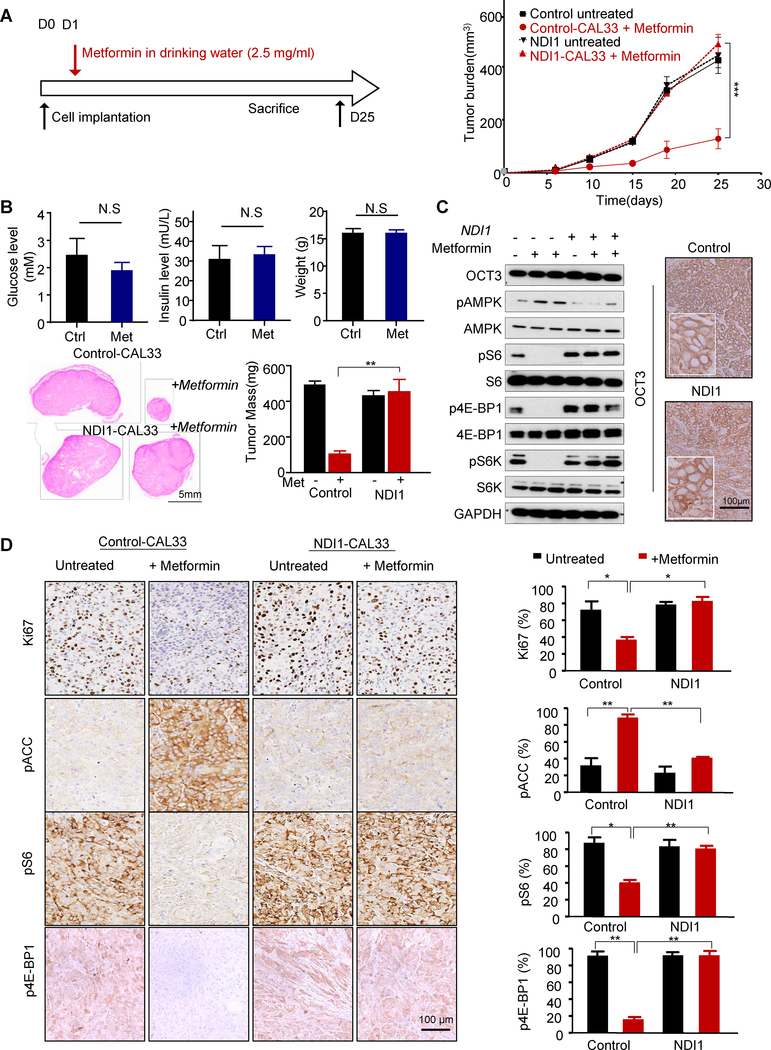
Figure 3.
Metformin antitumor effect in vivo requires functional complex I. A, Schematic representation of timescale for metformin treatment (in the drinking water, 2.5 mg/mL) in a mouse xenograft model, and in vivo growth curve of average tumor volume. Control mice received drinking water only while other groups received metformin (2.5 mg/mL) in drinking water for 3 days. B, Serum glucose and insulin levels and mice weight before and after metformin treatment are depicted. The average weight of tumors at the endpoint of the experiment; H&E staining of tumor sections with control CAL33 tumors are shown on top and the tumors from NDI1-CAL33 are shown at the bottom. C, The tumors were isolated and analyzed by western blot for OCT3, pS6/S6, pAMPK/AMPK, p4E-BP1/4E-BP1, pS6K/S6K and GAPDH expression. The cell surface OCT3 expression was also detect in the tissues by IHC staining. D, IHC staining of control and NDI1 expressing CAL33 tumor sections for Ki67, pS6, p4E-BP1 and pACC. Quantification from the stained sections are shown on the right. (*, P<0.05; **, P<0.01; ***, P<0.001; mean ± SD)

