Figure 5.
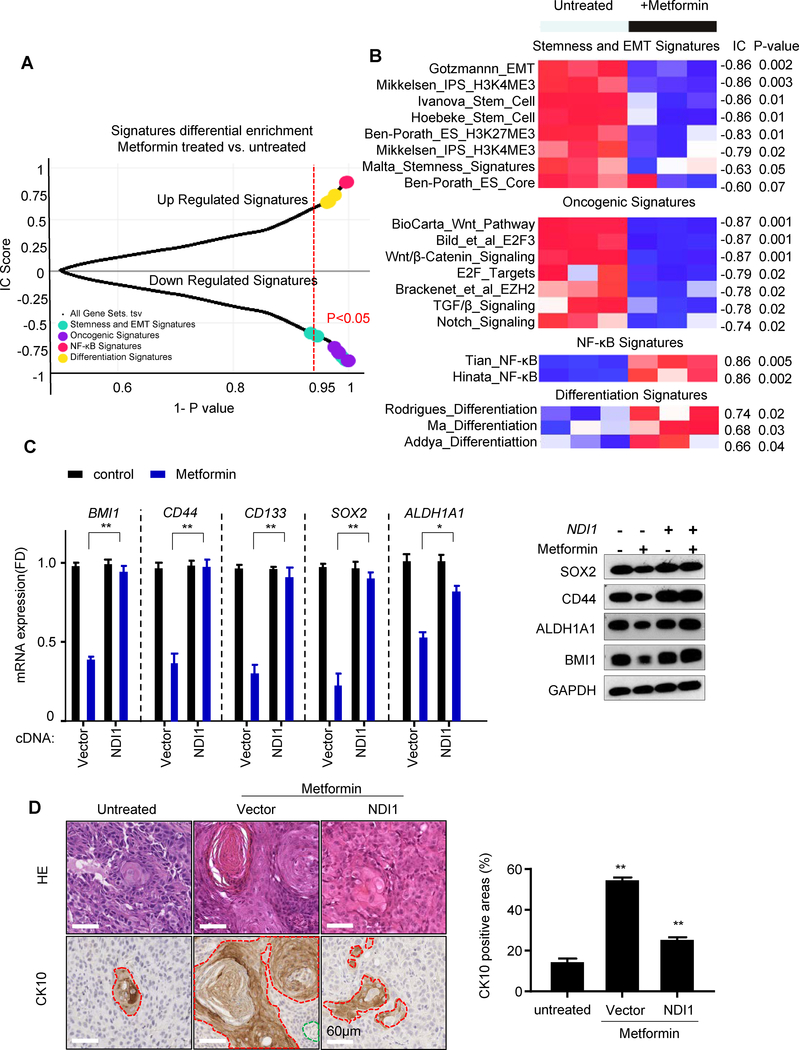
Metformin induced cancer cell differentiation, NFkB activation, and downregulation of cancer stemness and oncogenic signatures. A, Plot of Information Coefficient (IC) scores vs. p-values of GSEA profiles of transcriptional signatures matched against the untreated vs. treated metformin phenotype (see Supplementary Methods). B, Heatmap showing the individual signatures GSEA profiles. The bar on top is the untreated vs. treated metformin phenotype, and the numbers on the right are the IC scores and p-values. C, The expression of stemness markers were validated in control and NDI1-expressing cells treated with or without metformin in vivo measured by qPCR. The corresponding protein expression was detected by Western blotting. D, CK10 positivity was analyzed by immunohistochemistry in tumors. Representative H&E staining and CK10 positive areas are shown. CK10 positive tumor cells are surrounded by the red line, connective tissue by the green line, and the rest represent CK10 negative tumor cells. Quantitative analysis of CK10 positive areas are shown in the right graph. (*, P<0.05; **, P<0.01; mean ± SD)

