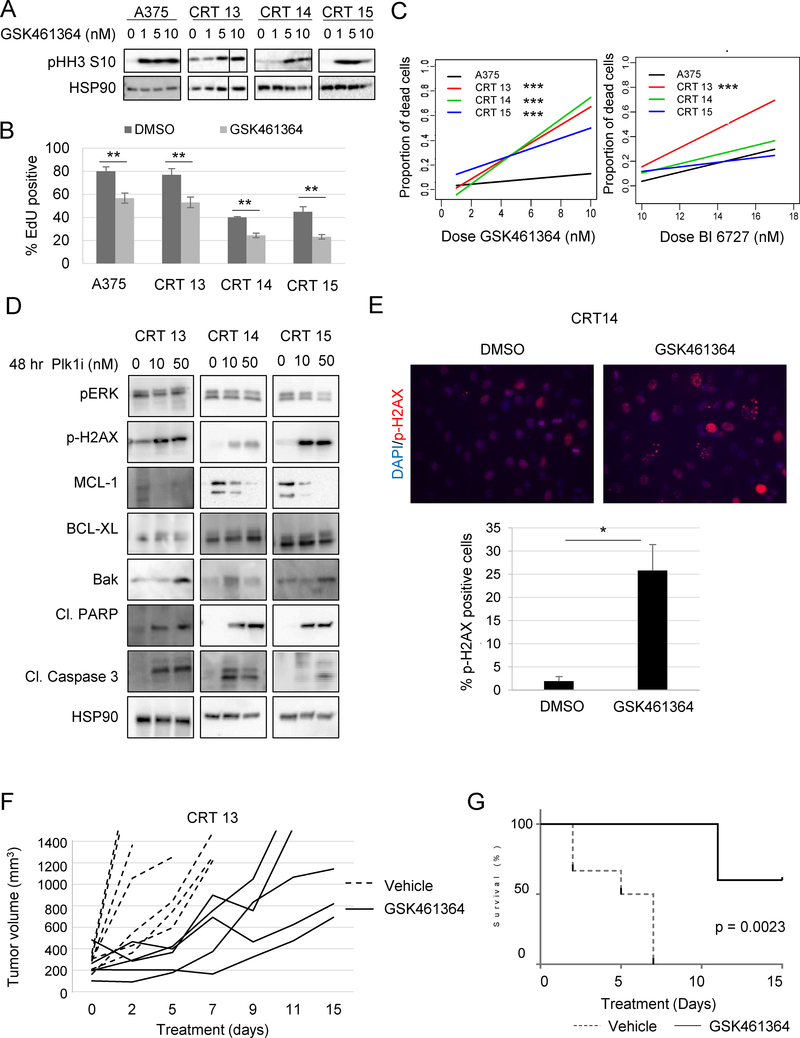
Fig 5. Plk1 inhibition induces cell death, leading to tumor growth delay of CRTs.
(A) Western blot analysis of cell lines treated for 24 hours with the indicated dose and probed for readout of Plk1 inhibition (n=3). (B) EdU incorporation of cells treated with Plk1 inhibitor (GSK461364; 50 nM) for 72 hours, **p<0.01 (n=3). (C) Slopes of the proportion of dead cells after 72 hours of treatment with indicated doses of GSK461364, ***p<0.001. (D) Western blot analysis of pERK½, p-H2AX, MCL-1, BCL-XL, Bak, cleaved PARP, and cleaved-caspase 3 after treatment with Plk1 inhibitor (GSK461364, n=3). (E) Immunofluorescent staining of p-H2AX in CRT14 after treatment with 20 nM GSK461364, *p<0.05 (n=3). (F) Tumor growth, indicated by change in volume over time, of CRT 13 tumors treated with Plk1 inhibitor (GSK461364; 25 mg/kg/dose) in nude mice. (G) Kaplan Meier survival curve of F, ***p<0.001.

