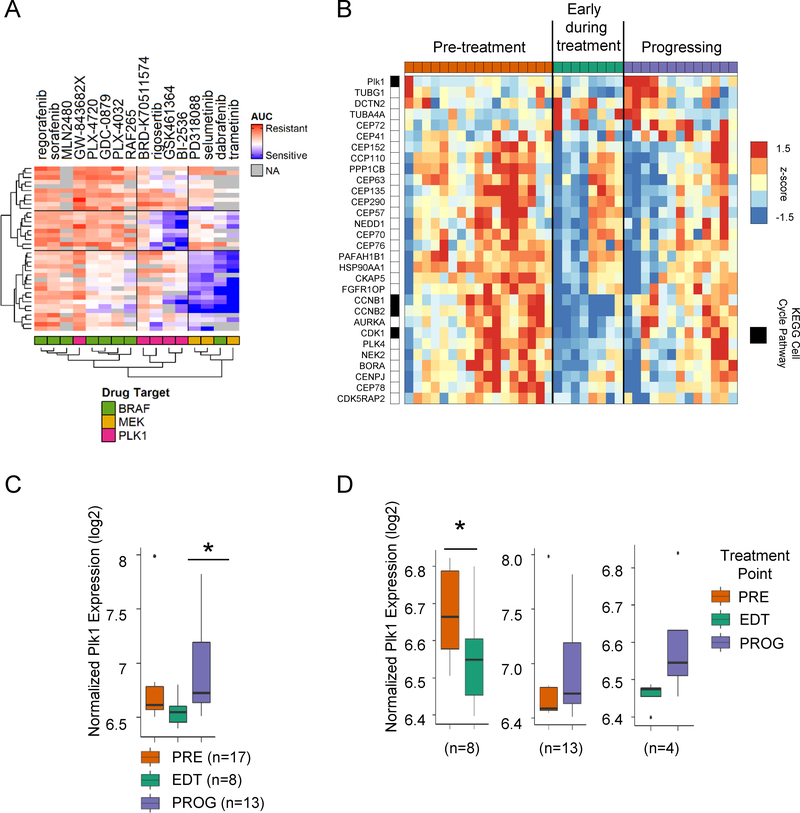
Fig 6. Plk1 expression changes in patients throughout stages of treatment.
(A) Heat map of the area under drug response dose curve (AUC) data for mutant BRAF melanoma cell lines (n=37), for BRAF, MEK and Plk1 inhibitors from the Cancer Therapeutic Response Portal (CTRP v2.1) data set. Missing drug sensitivity data are colored in gray. (B) Heat map of median-centered expression data for significantly altered genes (>50% fold-change) in the Regulation of Plk1 Activity at G/2M Transition gene set for pre-treatment (PRE), early-during treatment (EDT) and progressing on treatment (PROG) samples taken from patient tumors before, during or after dabrafenib, vemurafenib or dabrafenib plus trametinib treatment. Samples were separated based on treatment time points (row 1). KEGG cell cycle genes are indexed in black next to the gene name. Box plot showing normalized log2 Plk1 expression in (C) all samples and (D) matched samples from patients with PRE, EDT and PROG tumors. A linear model was used for statistical analysis of the aggregate (non-paired) Plk1 tumors and paired samples. Letters in the brackets identify which sub-image accurately represents the samples used.

