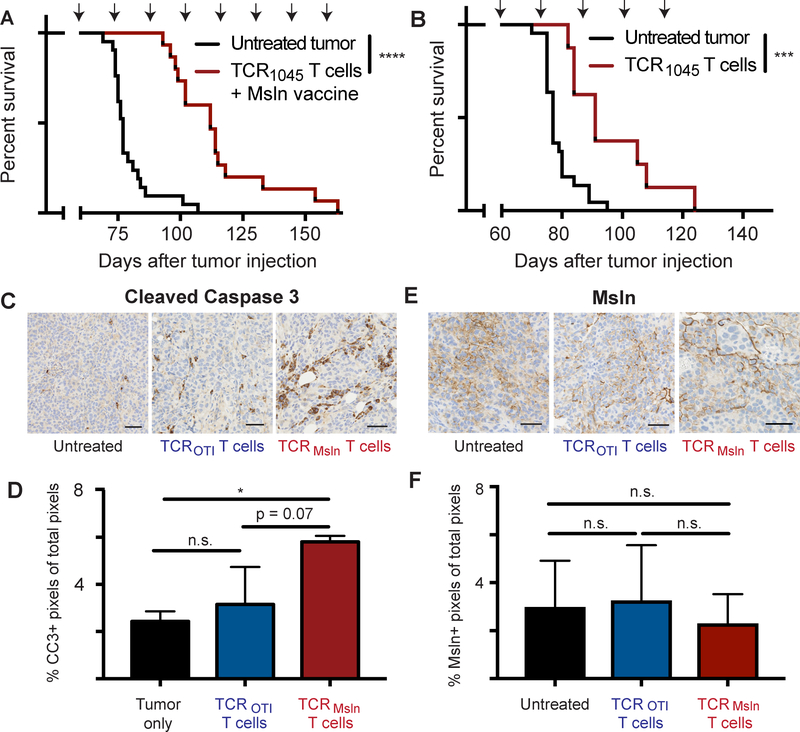
Figure 6. TCR1045 T cells prolong survival in ID8VEGF tumor-bearing mice.
A) Tumor-bearing mice received a single dose of cyclophosphamide before the 1st T-cell infusion followed by injections of 1×10⁷ TCR1045 T cells and peptide-pulsed irradiated splenocytes (5:1 APC:T-cell ratio) i.p. every 14 days with 1×10⁴ U IL2 s.c. for 10 days after each infusion. Treatment was initiated 45–52 days after tumor injection, when tumors were detectable by ultrasound. Survival data are aggregated from 4 independent experiments (n=15–21 total per group).
B) Tumor-bearing mice received 1×10⁷ TCR1045 T cells i.v. without a vaccine every 14 days with 1×10⁴ U IL2 s.c. for 10 days after each infusion. Therapy was started 45–52 days after tumor injection. Survival data was aggregated from 3 independent experiments (n=8–23 total per group). Survival curve comparison using the Log-rank (Mantel-Cox) or Gehan-Breslow-Wilcoxon tests yielded the same statistical results. *** p<0.0005 **** p < 0.0001. Arrows above survival curves in A and B indicate the timing of T-cell infusions.
C) IHC of tumor for Cleaved Caspase 3 following 3 doses of T cells. Untreated tumor-bearing mice were euthanized at the same stage of tumor development to serve as controls.
D) Quantitation of CC3 expression by IHC from mice euthanized in panel C above.
E) IHC of tumor for Msln following 3 doses of T cells, in mice from panels C and D. Untreated tumor-bearing mice were euthanized at the same stage of tumor development to serve as controls.
F) Quantitation of Msln expression by IHC from mice euthanized in panel E above. IHC experiments are representative of 2 independent experiments (n=3 mice per group per experiment). Scale bar = 50 microns. Data are shown +/− SD. Statistical analysis performed using one-way Anova with post-hoc analysis pairwise for multiple comparisons. * p<0.05, n.s. = not significant

