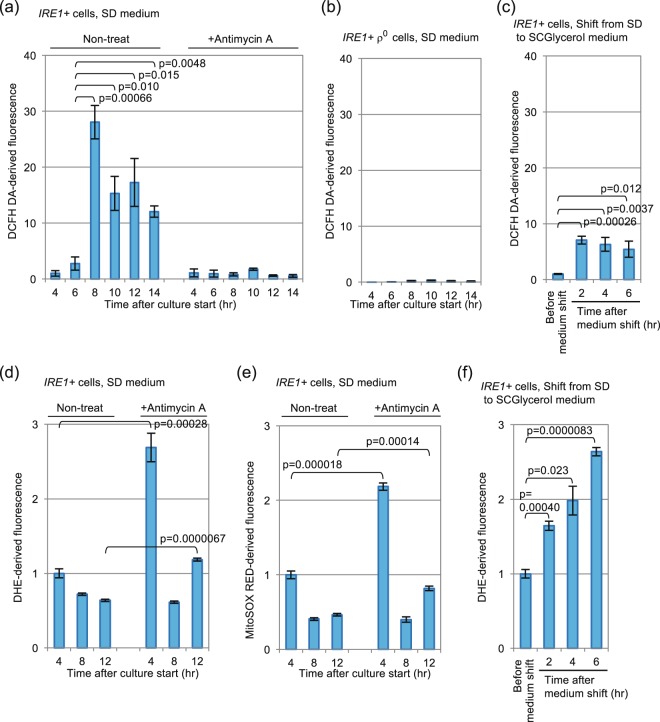
Figure 2.
Intracellular ROS level under the culturing conditions employed in this study. After being cultured in SD medium (a,b,d,e) or shifted from SD to SCGlycerol medium (c,f) for the indicated durations, IRE1+ cells or ρ0 IRE1+ cells were stained with DCFH-DA, DHE or MitoSOX for 30 min, and were analyzed by flowcytometry. In panel a, d and e, antimycin A (20 µM final concentration) was added into medium concomitantly with culture start. In all panels, all fluorescent values are normalized against that of the fermentatively growing IRE1+ cells (4-hr after culture start, Non-treated), which is set at 1.00.

