Figure 7.
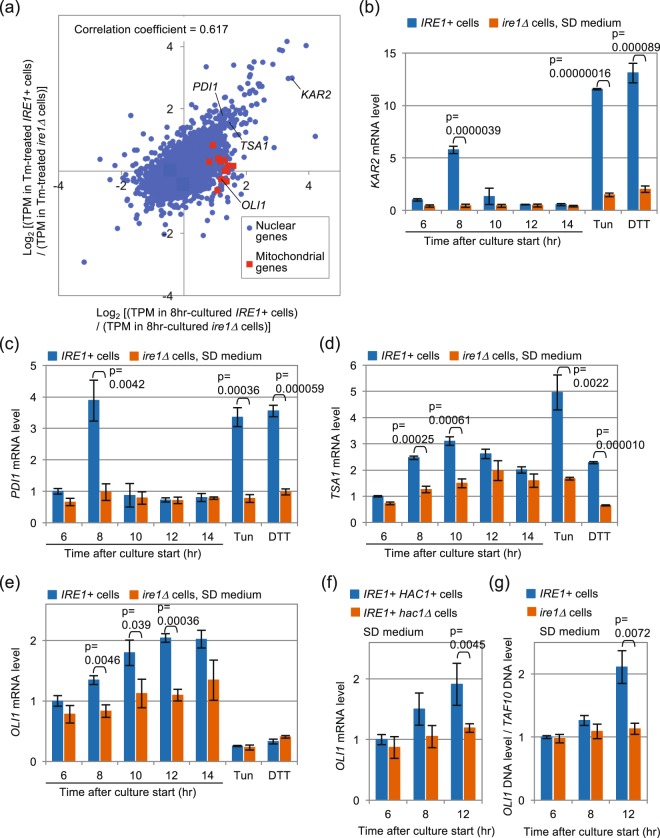
Ire1-dependent change of gene-expression profile under different conditions. (a) IRE1+ cells (two clones) and ire1Δ cells (two clones) upon diauxic shift (8 hr-culturing in SD medium) or under the canonical ER stress condition (2 µg/ml tunicamycin of 1 hr) were subjected to Illumina-based RNA sequencing and gene-expression profiling. The resulting TPM (transcripts per million) values of the resulting clones were used to calculate the x-axis and y-axis values of each gene. In this scatter plot, each dot represents one gene (5854 genes in total). Genes with TPM values of less than 1.00 under any conditions were not plotted. The ULI1 gene is plotted out of the graph area and is not shown here. (b–e) IRE1+ cells and ire1Δ cells were cultured in SD medium with or without the indicated external stress, and checked for the abundance of mRNAs of the indicated genes using qRT-PCR. (f) The same experiment as described in panel e was performed using the indicated strains. (g) Total DNA samples were analyzed by qPCR using OLI1-gene (mitochondria genome) specific and TAF10-gene (nuclear genome) specific primers. Expression levels of each gene (or ratios of OLI1 DNA level to TAF10 DNA level) are normalized against that of IRE1+ cells at time 6 hours, which is set at 1.00.

