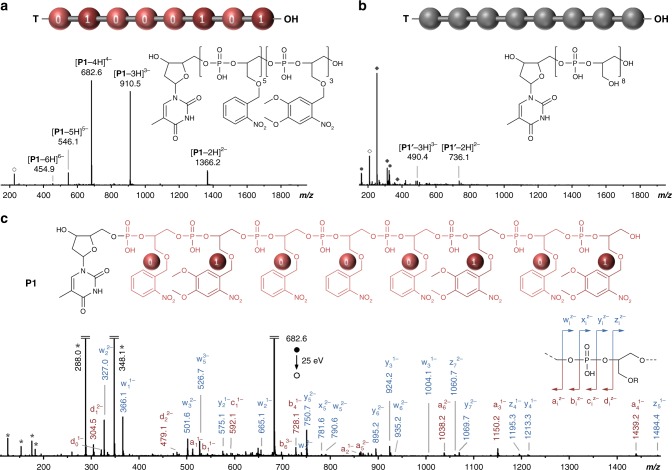
Fig. 2.
Example of a photo-erasable digital polymer. ESI-HRMS spectra obtained in the negative ion mode for polymer P1 before (a) and after (b) light exposure. Open and full dark gray circles indicate clusters of trifluoroacetic acid and trichloroacetic acid, respectively. Open and full dark gray diamonds indicate photo-deprotection by-products. See Supplementary Figs. 6, 7 and 15 for interpretation. c MS/MS sequencing of the coded polymer P1 before photo-erasing. This spectrum was obtained by collision-induced dissociation of the [P1-4H]4- precursor ion. The inset schematizes the fragmentation pattern of a phosphate repeat unit. Dark gray stars indicate secondary fragments including deprotonated repeat units at m/z 288.0 and m/z 348.1

