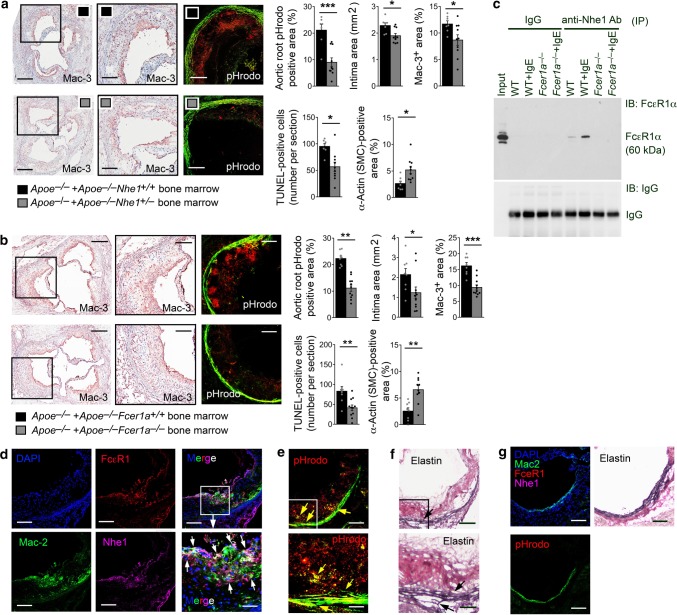
Fig. 4.
Role of macrophage Nhe1 in atherosclerosis. Quantification of aortic root pHrodo-positive area, intima area, Mac-3+ macrophage content, TUNEL-positive apoptotic cell number, and α-actin-positive SMC content in Apoe–/– mice received bone-marrow from Apoe–/–Nhe1+/+ (n = 7) and Apoe–/–Nhe1+/– (n = 10) donor mice a or received bone-marrow from Apoe–/–Fcer1a+/+ (n = 8) and Apoe–/–Fcer1a–/– (n = 11) donor mice b as indicated. Representative images of macrophage staining and pHrodo detection for panels a and b are shown to the left. Bars: 500 µm, inset bars: 200 µm. Data are mean ± SEM. Mann–Whitney U-test (intima area in b) and two-tailed Student’s t test (all other panels) were used for statistic analyses. *P < 0.05; **P < 0.01; ***P < 0.001. Source data are provided as a Source Data file. c Immunoprecipitation (IP) and immunoblot (IB) analysis of macrophages from WT and Fcer1a–/– mice after cells are treated with or without IgE. Cell lysate IP is performed using anti-Nhe1 antibody and IB is performed using either anti-FcεR1 antibody (top panel) or directly with HRP-conjugated anti-IgG antibody (bottom panel). Input cell lysate from IgE-treated WT macrophages is used as positive control. d Immunofluorescent triple staining for Mac-2 macrophages, FcεR1, and Nhe1 in atherosclerotic lesions from Apoe–/–Nhe1+/+ mice (n = 9). White arrows indicate FcεR1 and Nhe1 colocalization on Mac-2+ macrophages. Parallel sections of panel d are stained for pHrodo e and elastin f. Yellow and black arrows indicate elastin breaks. g Immunofluorescent triple staining for Mac-2, FcεR1, and Nhe1 in aortic root section from healthy WT mice (n = 4) as negative control. Parallel sections are stained for pHrodo and elastin. Bars in d–g: 200 µm, inset bars in d–f: 70 µm. Source data are provided as a Source Data file

