Fig. 5.
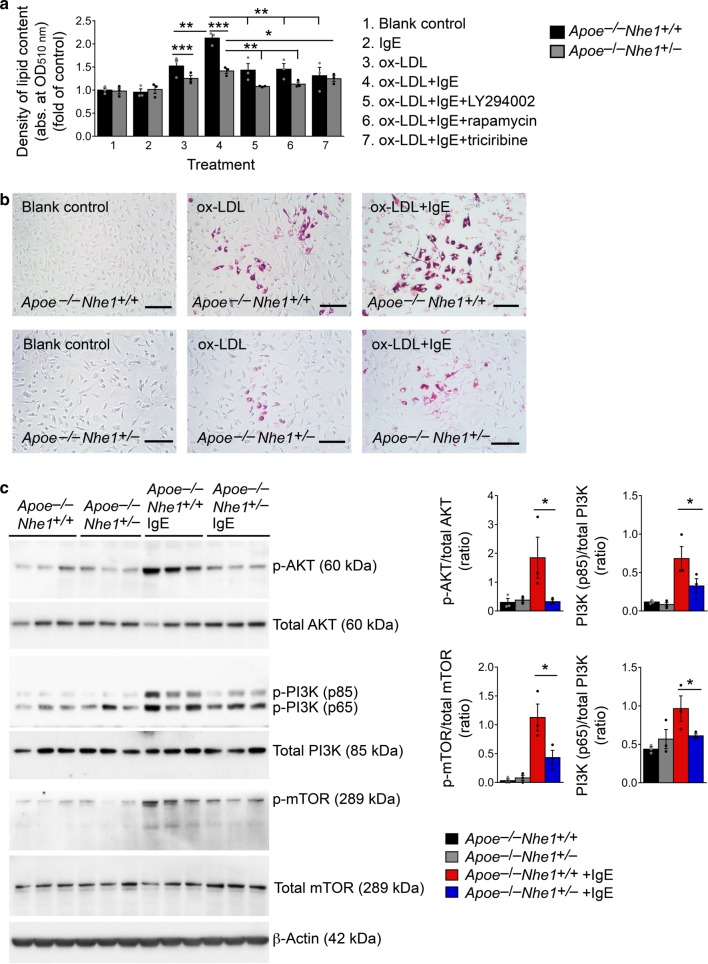
Role of Nhe1 in IgE-induced macrophage foam cell formation. Intracellular lipid quantification a and selected representative images b of macrophages from Apoe–/–Nhe1+/+ and Apoe–/–Nhe1+/– mice after treatment with or without IgE, ox-LDL, PI3 kinase inhibitor LY294002, AKT inhibitor triciribine, and mTOR inhibitor rapamycin as indicated. Bars: 200 µm. c Immunoblot analysis of (p)-AKT, (p)-PI3K, (p)-mTOR, and β-actin in macrophages from Apoe–/–Nhe1+/+ and Apoe–/–Nhe1+/– mice after treatment with and without IgE. Gel density quantifications are shown to the right. Data are presented as mean ± SEM from three independent experiments. One-way ANOVA test followed by a post hoc Tukey’s test (p-AKT/total AKT in c) and Kruskal–Wallis test followed by Dunn's procedure (all other panels) were used to compare three or more groups. *P < 0.05; **P < 0.01; ***P < 0.001. Source data are provided as a Source Data file

