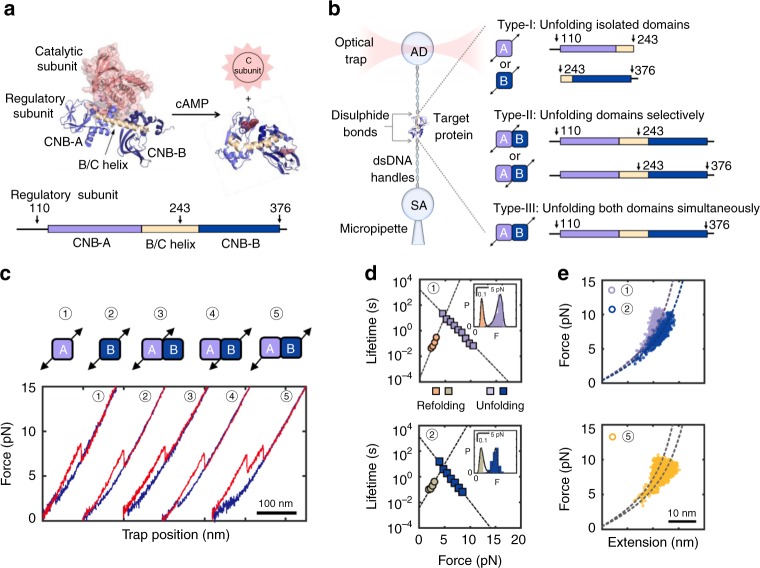
Fig. 1.
Experimental design to study allosteric activation in PKA with optical tweezers. a Structure of the inactive PKA holoenzyme (left)10 and active cAMP-bound regulatory subunit (right)11. The arrows on regulatory subunit domain organization indicate the residue positions for DNA handle attachment (bottom, arrows). Source data are provided as a Source Data file. b Schematic representation of optical tweezers assay (left) and protein constructs used in this study (right). c Force-extension curves for all pulling geometries in the apo state (unfolding in red; refolding in blue). Numbers match the pulling geometry with the unfolding and refolding trajectories. d Force-dependent folded-state lifetimes and unfolding force probability distribution (inset) in the apo state. Black lines in insets are the unfolding force distribution reconstructed from force-dependent lifetimes. e Worm-like chain (WLC) analysis of changes in extension vs. force for the isolated CNB domains (top) and for the first and second unfolding rips from the type-III construct (bottom). Dashed lines are the WLC curves for the CNB-A (purple) and CNB-B domains (blue). Numbering in d and e is the same as in c

