Fig. 2.
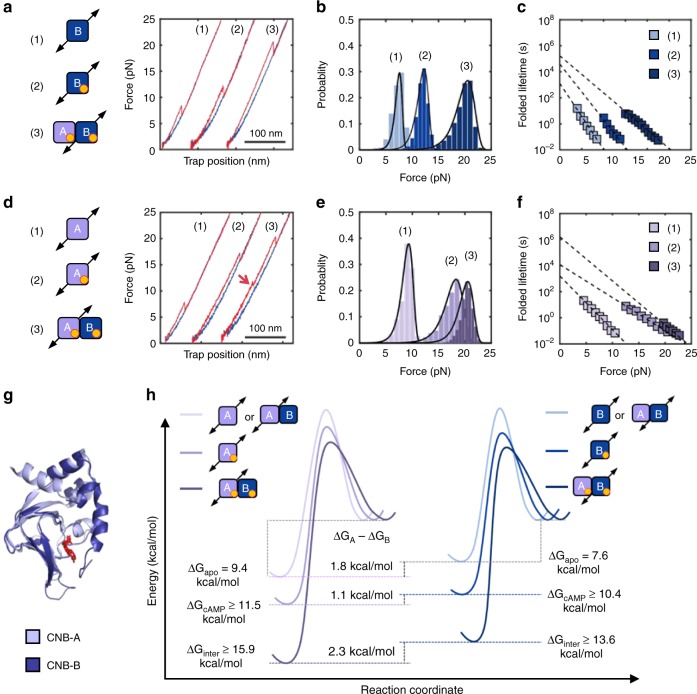
Selective allosteric effects initiated by cAMP binding. Force-extension curves (a, d), unfolding force probability distributions (b, e), and force-dependent folded-state lifetimes (c, f) for the CNB-B (top) and CNB-A (bottom) domains. Numbering corresponds to the isolated CNB domains in the apo (1) or cAMP-bound states (2), and selective unfolding of the CNB domains bound to cAMP (3). The red arrow in d indicates the unfolding of the N3A motif. Source data for a through d are provided as a Source Data file. g Structural alignment of the CNB-A (light purple) and CNB-B (dark blue) domains bound to cAMP (red). h Energy landscape and free energy of the CNB domains due to cAMP binding and inter-domain contacts. The height of the energy barriers reflects the folded and unfolded-state lifetimes of the CNB domains in the different states. The energy landscapes have been normalized to the unfolded state. (Supplementary Tables 1 and 2)

