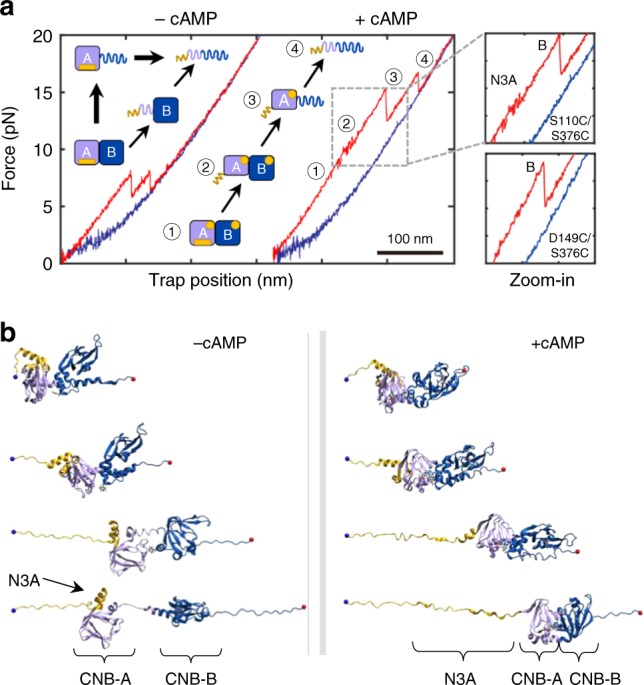
Fig. 3.

Dual unfolding pathways of PKA regulatory subunit depending on cAMP occupancy. a Force-extension curve for the cAMP-free (left) and cAMP-bound (right) regulatory subunit (type-III construct). The cartoon represents the structural transitions occurring during the unfolding trajectory in apo- and cAMP-bound states. Zoomed-in are the unfolding trajectories of type-III constructs S110C/S376C and D149C/S376C bound to cAMP. A detailed analysis of the forces for each unfolding transition refer to Supplementary Information and Supplementary Table 4. b Representative structures from cluster analysis along the SMD trajectories of the cAMP-bound (left) and apo (right) regulatory subunit. Yellow: N3A motif; Purple: CNB-A; Dark blue: CNB-B domain
