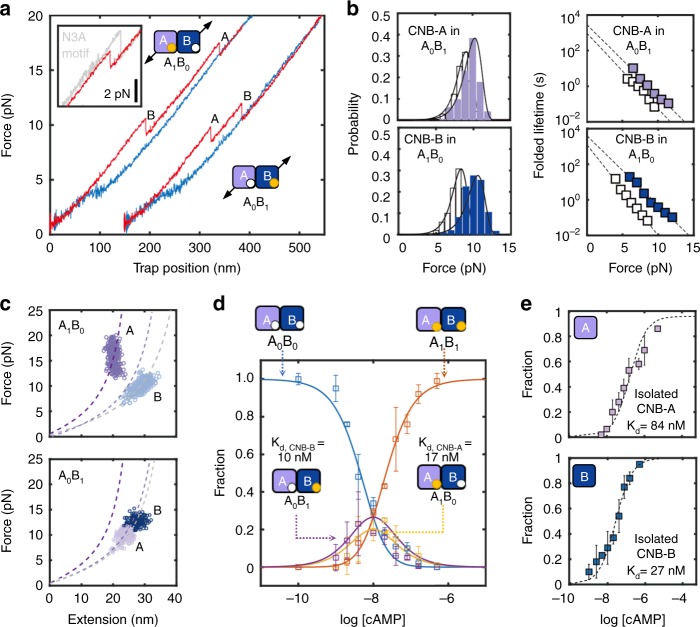
Fig. 5.
Stepwise stabilization between CNB domains in partial cAMP-bound states. a Representative force-extension curves of two intermediate-liganded states (A1B0 and A0B1) for the type-III regulatory subunit S110C/S376C. Zoomed-in are the unfolding trajectories of A1B0 compared with fully bound state (i.e., A1B1), showing the lack of N3A motif hopping in A1B0. b Unfolding force probability distribution and force-dependent folded-state lifetimes for intermediate-liganded states: CNB-A domain in A0B1 (top) and CNB-B domain in A1B0 (bottom). The corresponding isolated domains in the apo state (white bars and symbols) are shown for comparison. Solid lines are the unfolding force distribution reconstructed from force-dependent lifetimes. c WLC analysis of changes in extension upon unfolding vs. force in A1B0 and A0B1 for the CNB-A and CNB-B domains (dashed lines). Expected WLC curves are shown for CNB-A domain without the N3A motif (dark purple) and with the N3A motif (light purple). d cAMP titration plot showing the fraction of apo (A0B0), intermediate (A1B0 or A0B1), and fully bound (A1B1) species. Lines correspond to the global fit to the equations for each population species (Supplementary Methods). Error bars are the weighted SD of different single molecules. e Fractional titration plot of isolated CNB-A (top) and CNB-B (bottom) domains (type-I constructs). The error bar corresponds to the SD of five to ten different molecules

