Fig. 7.
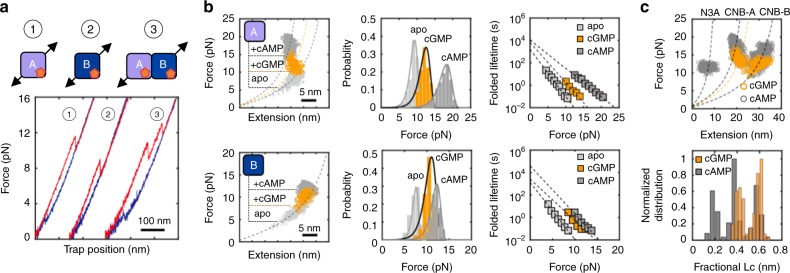
Perturbation of allosteric networks in PKA by cGMP. a Force-extension curves of cGMP-bound protein constructs. b WLC analysis of changes in extension upon unfolding vs. force (left), unfolding force probability distributions (center) and force-dependent folded-state lifetimes (right) for the isolated CNB-A (top) and CNB-B (bottom) domains in the apo (light gray), cGMP-bound (orange), and cAMP-bound (dark gray) states. Solid lines in center panels are the unfolding force distribution reconstructed from force-dependent lifetimes. c WLC analysis of changes in extension upon unfolding vs. force (top) and fractional contour length (bottom) of the regulatory subunit bound to cGMP (orange) and cAMP (gray). Dashed lines are the WLC curves for the N3A motif and the two CNB domains with cAMP (gray) and cGMP (orange). Source data are provided as a Source Data file

