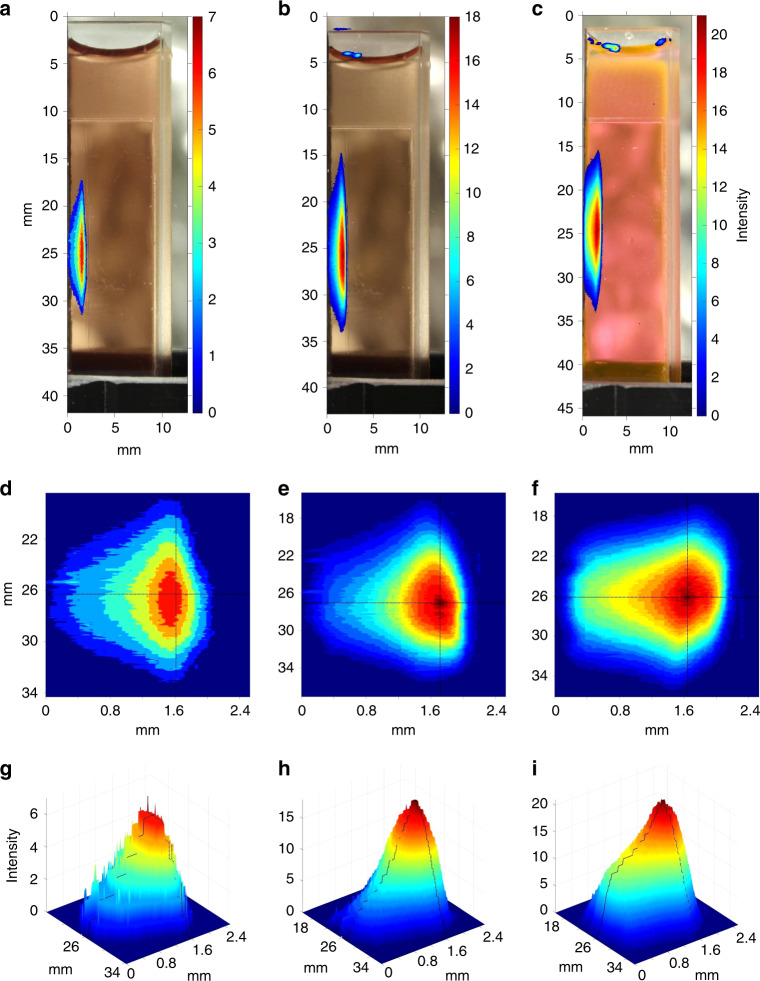
Fig. 2.
Imaging of proton-induced fluorescence. a–c Fluorescence images captured during proton irradiation by a Samsung NX1000 camera (F-stop f/5.6, ISO speed 200) after a long pass filter with a cut-off wavelength of 610 nm. The resulting images were processed with MATLAB® to yield heat map representations of the fluorescence emission. a mTHPC 55 μM in DMSO. b PpIX 70 μM in dimethyl sulfoxide (DMSO) c Erythrosin B 110 μM in DMSO. d–f Top-view 2D contour heat map representations of a–c in an expanded scale. The black lines cross at the estimated position of fluorescence maximum. g–i Corresponding 3D representations of (d–f). Again, the black lines denote the estimated position of the maximum

