Fig. 3.
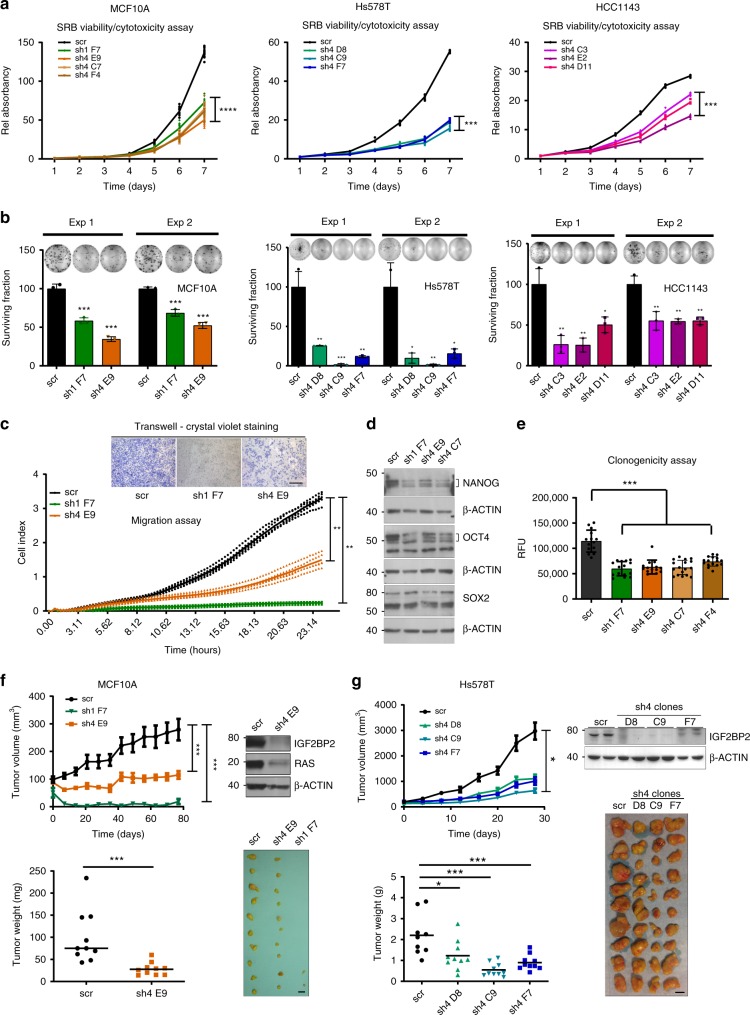
RPSAP52 displays oncogenic features in breast cancer cells. a Viability/cytotoxicity assays in MCF10A, Hs578T and HCC1143 clones. The experiment was performed three times and one representative graph is shown for each cell line. Values are mean ±SD of n ≥ 6 measurements. One-way ANOVA was used (***P < 0.001, ****P < 0.0001). b Effect of RPSAP52 silencing on colony formation ability. Representative plates are shown. Colonies were counted from three replicate plates and two independent experiments. Values are mean ±SD. Two-tailed unpaired t-test were used (*P < 0.05, **P < 0.01, ***P < 0.001, ****P < 0.0001). c Migration capacity of RPSAP52-depleted clones was monitored over 24 h (n = 5 replicates per condition), with higher cell index indicating higher migration. Values are mean ±SD. A two-tailed Mann–Whitney U test of data at end point was used (**P < 0.01). Inset: migration was also assessed with transwells. Scale bar = 100 µm. d Western blot analysis of NANOG, OCT4, and SOX2 in RPSAP52-depleted cells. e The clonogenic ability was assessed with at least n = 12 replicates per condition. Values are mean ±SD. A two-tailed Mann–Whitney U test was used (***P < 0.001). f Growth-inhibitory effect of RPSAP52 knockdown in MCF10A mice xenografts. Upper graph: tumor volume (n = 10) was monitored over time. Mean values are shown ±SEM. Lower graph: tumors were excised and weighed at 77 days (***P < 0.001, two-tailed Mann–Whitney U test). Western blot was carried out from sh4 tumors since no material could be recovered from sh1 tumors, and the levels of RAS and IGF2BP2 proteins were analyzed. The photograph shows the relative size of all tumors extracted. Scale bar = 10 mm. g Growth-inhibitory effect of RPSAP52 knockdown in Hs578T mice xenografts. Upper graph: tumor volume (n = 9 for scr and n = 10 for sh4 clones) was monitored over time. Mean values are shown ±SEM. Lower graph: tumors were excised and weighed at 28 days (*P < 0.05, ***P < 0.001, two-tailed Mann–Whitney U test). Western blot was carried out from tumors at end point and the levels of IGF2BP2 protein were analyzed. The photograph shows the relative size of all tumors extracted. Scale bar = 10 mm. Source data are provided as a Source Data file

