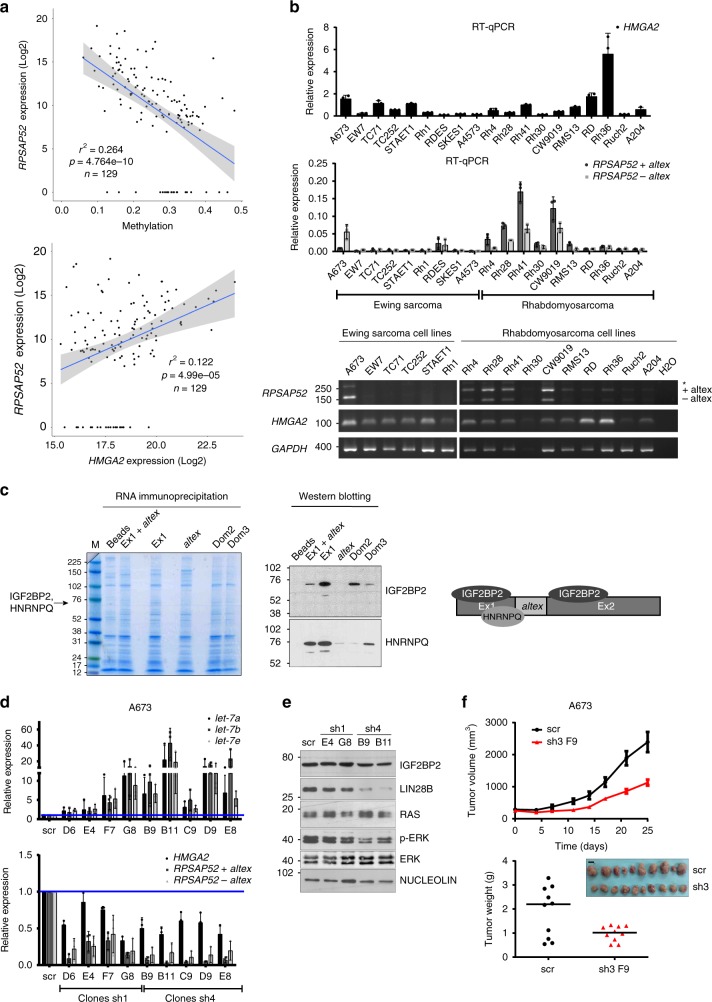
Fig. 4.
RPSAP52 is abundantly expressed in sarcoma and regulates the LIN28B/let-7 balance. a Upper graph: Pearson coefficient between RPSAP52 expression levels and CGI methylation in the TCGA sarcoma cohort indicates a negative correlation. Lower graph: Pearson’s index indicates a weaker association between RPSAP52 and HMGA2 expression levels in the same cohort. b Upper graphs: RT-qPCR analysis to estimate HMGA2 and RPSAP52 expression levels in a panel of Ewing’s sarcoma and rhabdomyosarcoma cell lines. Expression is relative to GUSB mRNA levels. Graphs represent the mean ±SD of three independent RNA extractions. Lower panel: semi-quantitative RT-PCR analysis of expression in the same cell lines. The two RPSAP52 isoforms are indicated, and the higher-migrating band depicted by an asterisk contains an additional exonic sequence (encompassing coordinates chr12:66,169,917–66,170,002 (hg19)), detected in those cells lines with the highest expression of RPSAP52. c RNA pull-down assays confirm the interaction of RPSAP52 with IGF2BP2 and HNRNPQ in A673 cell extracts. Different truncated fragments of RPSAP52 were assayed as indicated, and the band identified by MS and corresponding to IGF2BP2 and HNRNPQ is indicated on the protein gel (left). Western blot to test the association between RPSAP52 RNA and IGF2BP2 and HNRNPQ proteins (middle panel). The drawing summarizes the data obtained from the pull-downs (right). d Total RNA from A673 stable clones constitutively expressing sh1 or sh4 shRNA sequences was analyzed by RT-qPCR to assess HMGA2 and RPSAP52 transcripts levels (lower graph) or let-7 miRNAs levels (upper graph). Graphs represent the mean ±SD of three independent replicates. e Western blot on A673 clones to analyze protein levels upon stable knockdown of RPSAP52 transcripts. f Growth-inhibitory effect of RPSAP52 knockdown in A673 mice tumor xenografts. Upper graph: tumor volume (n = 10) was monitored over time. Mean values are shown ±SEM. Lower graph: tumors were excised and weighed at 25 days. The photograph shows the relative size of all tumors extracted. Scale bar = 10 mm. Source data are provided as a Source Data file

