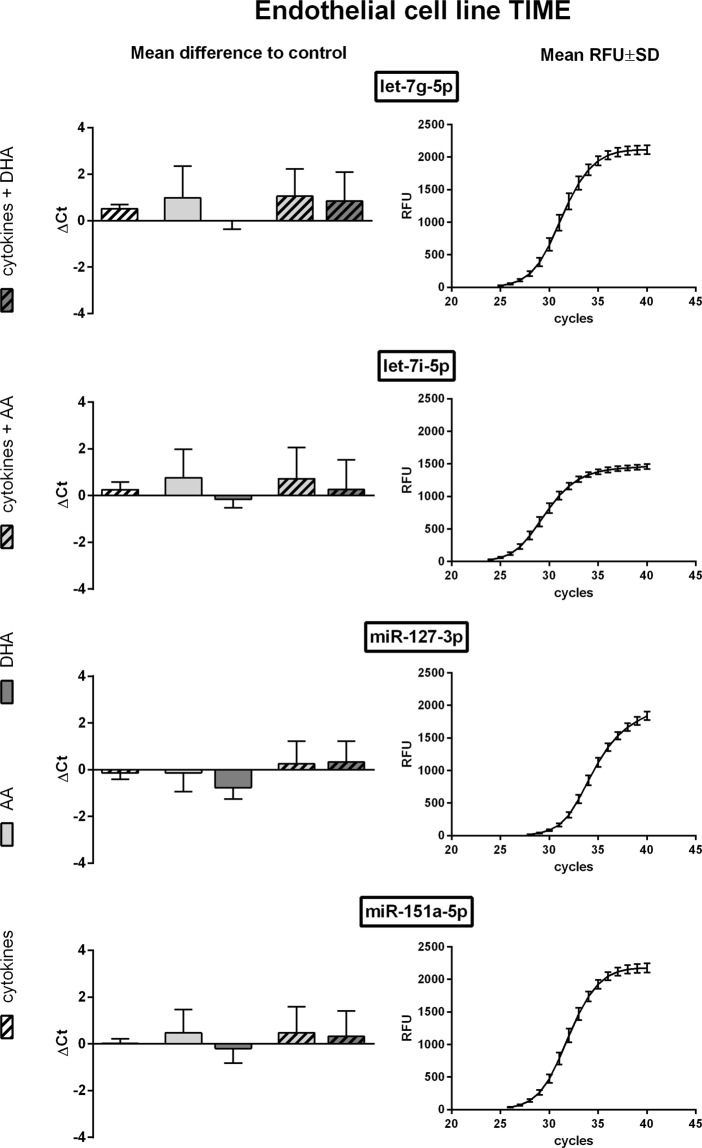
Figure 1.
qRT-PCR data of TIME cells. TIME were stimulated with a cytokine mix consisting of IL-1β, TNF-α and IFN-γ (each in a concentration of 5 ng/ml) and/or supplemented with the unsaturated fatty acids docosahexaenoic acid (DHA, C22:6n3) or arachidonic acid (AA, C20:4n6). Quantification of miRNA expression was performed by means of the miRCURY LNA SYBR Green PCR kit and appropriate miRCURY LNA miRNA PCR assay primers on a CFX96 Touch Real Time PCR detection system (N = 4, n = 2). The fluorescence signal of all samples was measured at the end of every PCR cycle as relative fluorescent unit (RFU). miRNA expression is displayed as mean difference to unstimulated control on the basis of raw Ct values. The mean RFU values and standard deviations are plotted as a sigmoidal curve.

