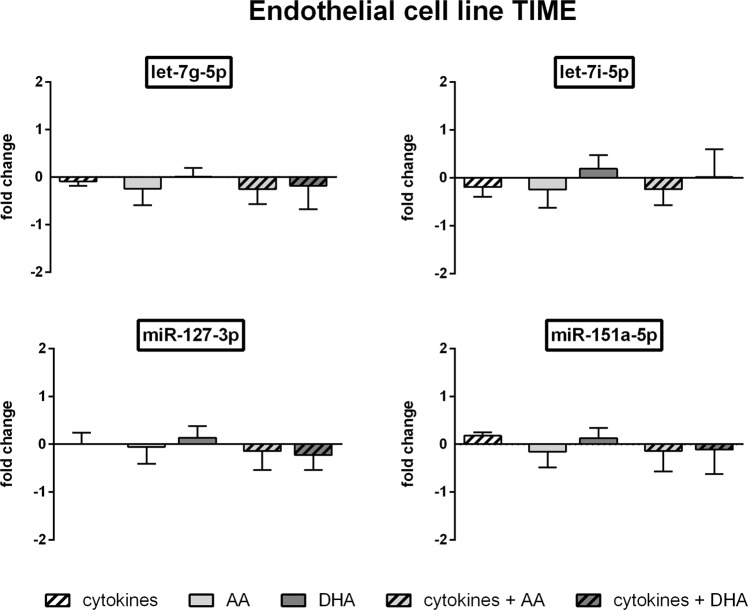
Figure 3.
ddPCR data of TIME cells. TIME were stimulated with a cytokine mix consisting of IL-1β, TNF-α and IFN-γ (each in a concentration of 5 ng/ml) and/or supplemented with the unsaturated fatty acids docosahexaenoic acid (DHA, C22:6n3) or arachidonic acid (AA, C20:4n6). Absolute quantification of miRNA expression was performed by means of the EvaGreen Supermix and appropriate miRCURY LNA miRNA PCR assay primers on a QX200 ddPCR droplet reader system (N = 4, n = 2). miRNA expression was measured as RNA molecules per µl sample. Results are displayed as fold change to unstimulated control.

