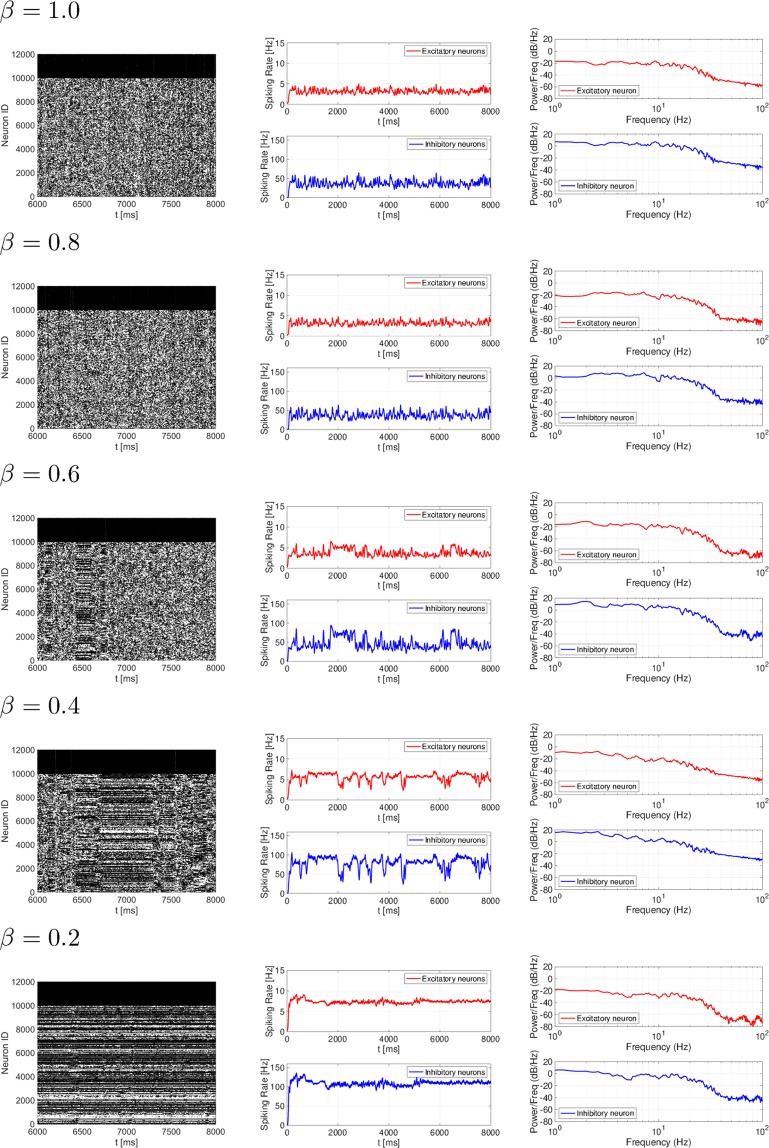
Figure 2.
Rewiring probability β dependency of spiking activity in a spiking neural network with small-world network for strong synaptic connections and random network for weak synaptic connections (β = 1.0, 0.8, 0.6, 0.4, 0.2). The left, middle, and right images represent the raster plot, spiking rate time-series for rE (upper) and rI (lower), and their power spectrum, respectively. In the β = 1.0, 0.8 case, an irregular spatio-temporal spike pattern was observed. With decreasing β values (β = 0.6, 0.4, 0.2), constant spike patterns with a higher spiking rate [rE ≈ 5.0 Hz, (rI ≈ 70 Hz) in the β = 0.6 case, rE ≈ 6.0 Hz (rI ≈ 100 Hz) in the β = 0.4 case, and rE ≈ 7.0 Hz (rI ≈ 110 Hz) in the β = 0.2 case] were maintained in a specific duration.

