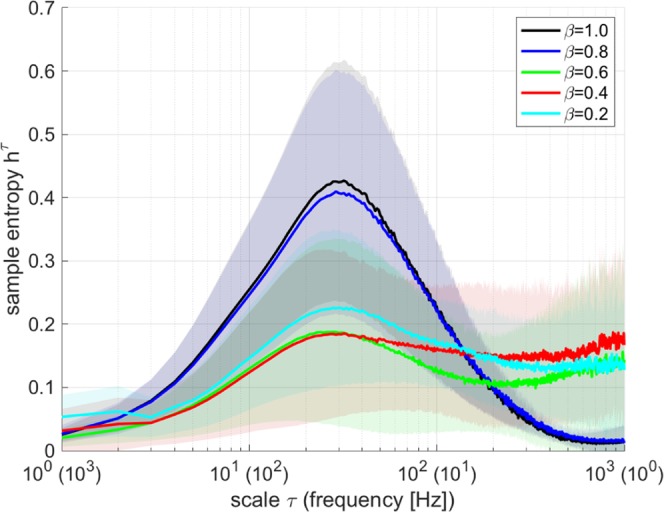
Figure 5.

Profile of multiscale entropy as a function of temporal scale τ for the time series of the excitatory spiking rate rE (the width of the temporal scale is 1 ms). The mean and standard deviation between trials are represented by the solid and shaded areas, respectively. In the β = 1.0, 0.8 case, hτ exhibits a peak at τ ≈ 20 (50 Hz). With decreasing β values such as β = 0.6, 0.4, 0.2, the hτ in the larger τ (i.e., small frequency) regions increases (τ ≳ 200 (5 Hz)).
