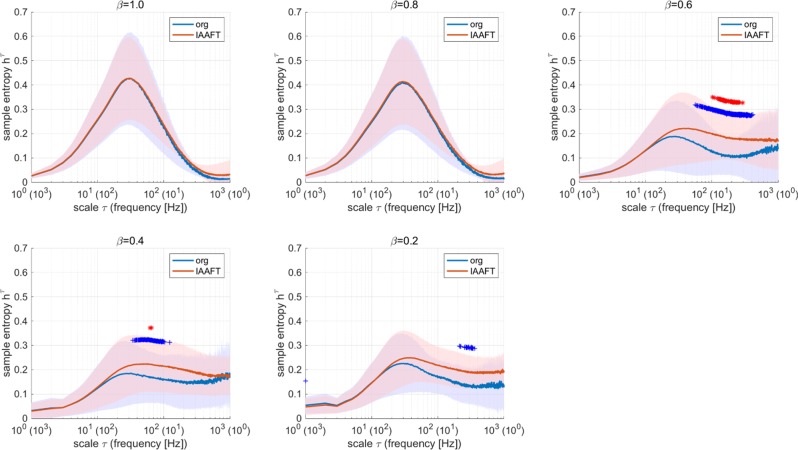
Figure 7.
Comparison between multiscale entropy profiles of the original rE and those of the IAAFT surrogate data. The cases in which differences in hτ are statically significant are represented by blue (+p < 10−2) and red (*p < 10−3). A significant difference between the original/IAAFT ones is observed at τ ≈ 200 (5 Hz) in cases of β = 0.6, 0.4, 0.2; the MSE profile at large temporal scales reflects a nonlinear dynamic process. Org: original; IAFFT: Iterative amplitude-adjusted Fourier transformed.

