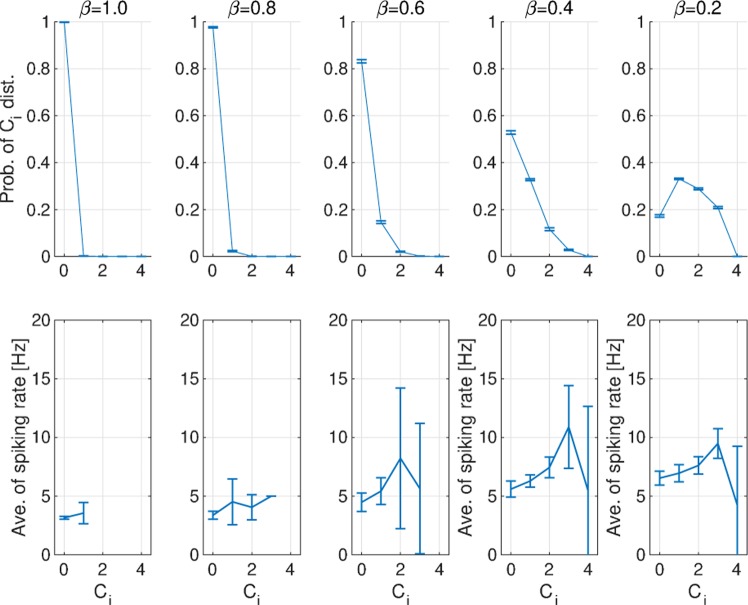
Figure 9.
Relationship between spiking activity and clustering structures. Probability distribution of the number of triangles around node i: Ci (upper) and dependence of the temporal average spiking rate of the excitatory neural population on Ci (lower). A neuron with high Ci exhibits a tendency toward a high spiking rate, compared with the case of Ci = 0. Ci: number of triangles around node i. Ave.: average; Prob.: probability; Dist.: distribution.

