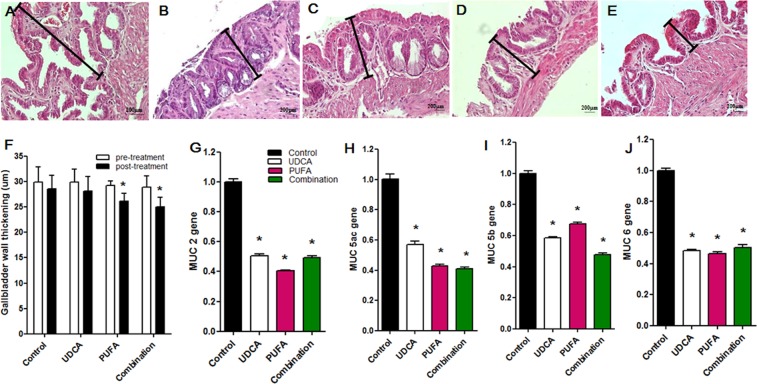
Figure 3.
Histological mucosal changes, thickness of the gallbladder wall, and expression levels of MUC genes in the gallbladder. The photographs demonstrate the microscopic features of the gallbladder. (A) Lithogenic diet (LD) induced mucosal hypertrophy of the gallbladder in the pre-treatment stage (after feeding the lithogenic diet for 8 weeks). (B–E) Gallbladder wall thickening was compared between the control group and three treatment groups ((B) control group; (C) UDCA group; (D) PUFA group; and (E) combination group) in the post-treatment stage (after administration of the therapeutic agent with the regular diet for 12 weeks). The treatments reduced the thickness of the hypertrophied gallbladder wall. (F) The thickness of the gallbladder wall decreased significantly in the PUFA and combination groups. (G) Muc2, (H) Muc5ac, (I) Muc5b, and (J) Muc6 expression levels in the gallbladder decreased significantly in the UDCA, PUFA, and combination groups. *P < 0.05 vs. control group.

