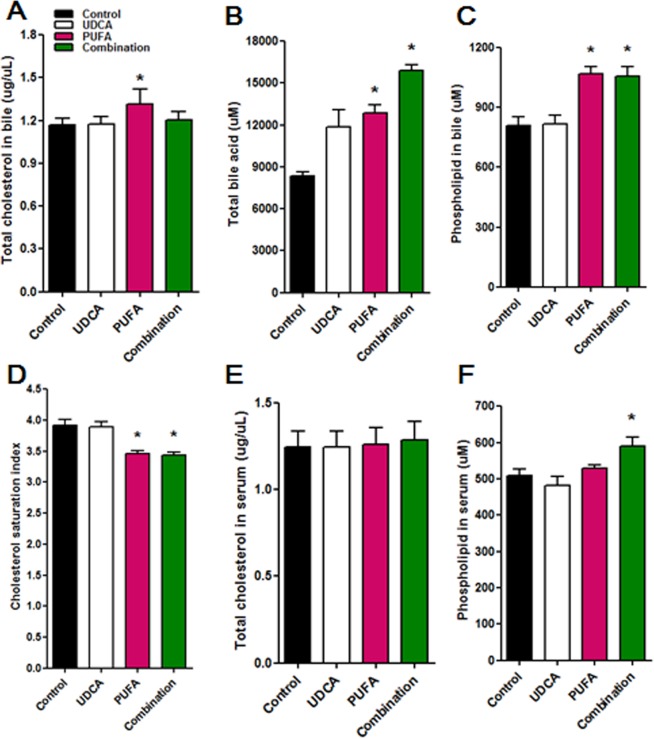
Figure 4.
The CSI and levels of total cholesterol, phospholipids, and bile acids. (A) Total cholesterol level in the bile increased significantly in the PUFA group. (B,C) Both the PUFA and combination groups had significantly increased bile acid (B) and total phospholipid levels in bile (C). (D) As a result, the CSI decreased significantly in the PUFA and combination groups. (E) Total serum levels of cholesterol were similar among the groups. (F) Serum levels of phospholipids increased significantly in the combination group. *P < 0.05 vs. control group.

