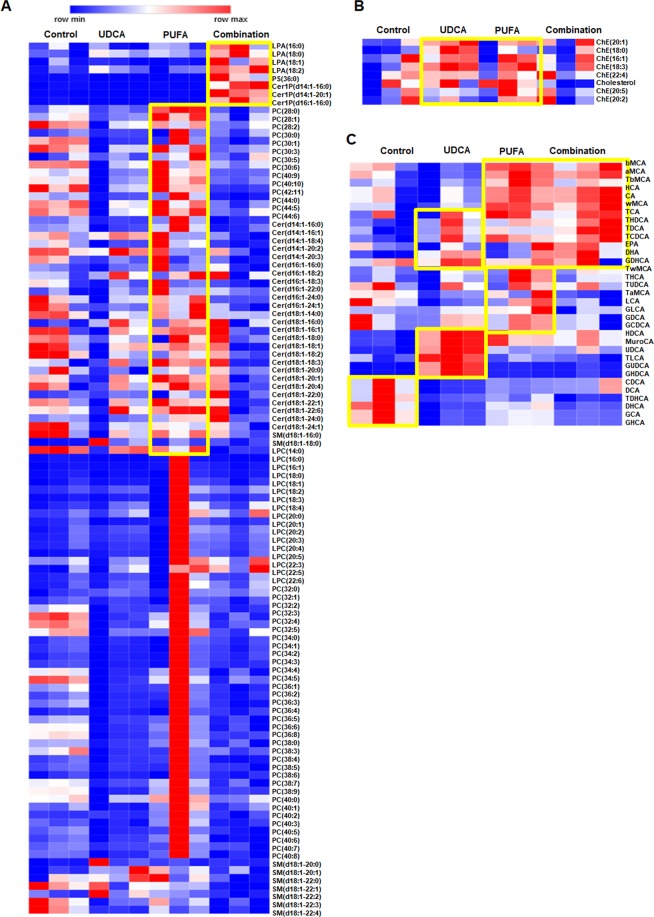
Figure 5.
Heat maps of bile phospholipid, cholesterol, and bile acid classes. Heat map analysis of (A) phospholipid classes (e.g., phosphatidylcholine, lysophosphatidylcholine, lipoprotein (a), PS, sphingomyelin, dihydroceramide 1-phosphate, ceramide 1-phosphate), (B) cholesteryl ester and cholesterol, and (C) various bile acids. Lipid subclass profiles across the four types. Each colored four types on the map depends on a concentration value. Data in the heat map of measured by Euclidean distance using Ward clustering algorithm.

