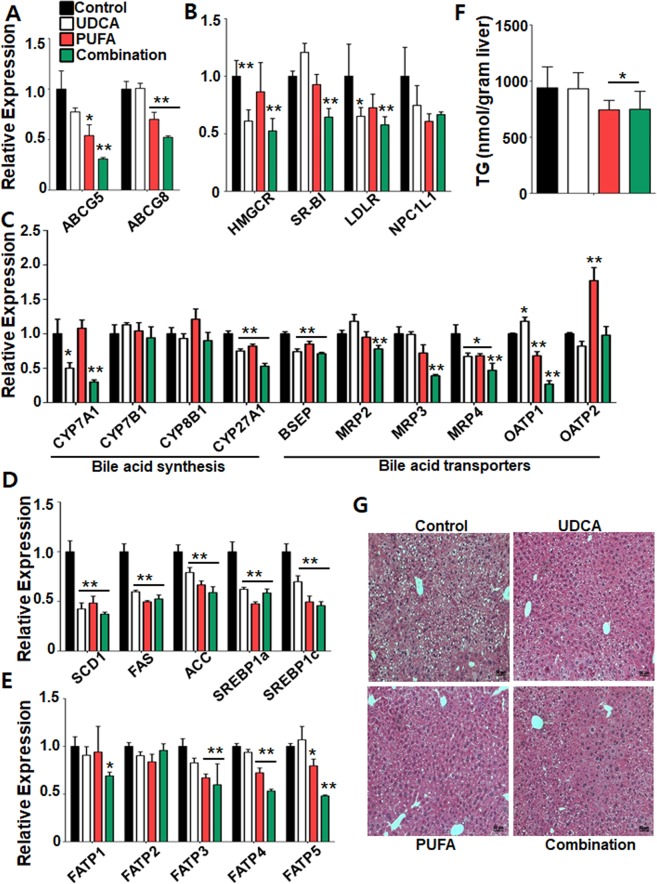
Figure 6.
Cholesterol and bile acid production and transport, and expression levels of related genes. Hepatic expression levels of genes related to (A) canalicular efflux, (B) cholesterol synthesis, (C) bile acid synthesis and bile acid transporters, (D) lipogenesis, and (E) fatty acid transporters. Expression levels were normalized to that of β-actin. (F) Hepatic triglyceride levels. (G) Microscopic features of the liver. *P < 0.05 and **P < 0.01 vs. control group. Data are mean ± standard error of the mean (SEM).

